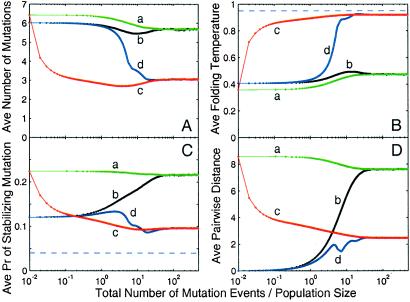
Fig 3.
For the structure shown in Fig. 1B, evolutionary dynamics of a sequence population with size N = 100,000 is measured by ensemble averages of four quantities: (A) d; (B) Tf; (C) ps; and (D) average pairwise distance between sequences in the population, a measure of the population spread in sequence space. The x axis is evolutionary time on a logarithmic scale, measured by the total number of mutation events divided by the population size, i.e., total number of mutation events per sequence. Four lines are shown: a, b, c, and d. Lines a and b represent evolutionary dynamics with mutation events only, whereas lines c and d represent evolutionary dynamics with dominant recombination events (nr/nm = 1,000). Lines a and c represent evolutionary dynamics under the initial condition that every member in the population is chosen randomly from the set of sequences compatible with the target structure, whereas lines b and d represent evolutionary dynamics under the initial condition that all members in the population are identical to a sequence chosen randomly from the set of sequences compatible with the target structure. Dashed lines represent the values for the prototype sequence.

