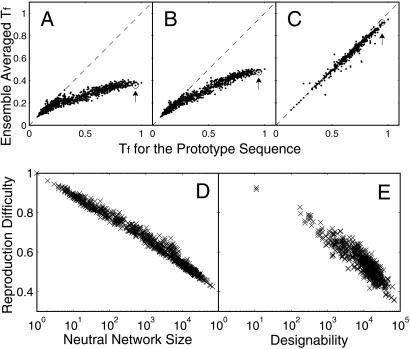
Fig 5.
How does evolution affect protein thermodynamics for all neutral networks and structures. (A and B) Average Tf in sequence population before (A) and after (B) selection by evolution with mutation events only vs. Tf for the prototype sequence, for all 2,977 neutral networks. (C) Average Tf in sequence population after selection by evolution with dominant recombination events (nr/nm = 1,000, N = 10,000) vs. Tf for the prototype sequence, for 638 of a total of 1,081 structures that converge after 100 mutations per individual. Most of the remaining structures that do not converge have small designability (70% of them have designability less than 10,000), and many of them have at least two competing neutral networks of similar size. These structures are not taken into account here. Arrows mark the prototype sequence. (D and E) Reproduction difficulty, nl/nm, is shown to depend primarily on neutral network size/designability for all neutral networks/structures, both in the case with mutation events only (D), and in the case with dominant recombination events (nr/nm = 1,000, N = 10,000) (E). The x axis is neutral network size/designability on a logarithmic scale. Little correlation exists with the detailed neutral network topology. The structure with the highest designability (and also the largest neutral network), depicted in Fig. 1B, has the lowest reproduction difficulty, regardless of the ratio of recombination to mutation rates. In the long run this structure will dominate the population in the absence of additional functional selection.

