Fig 3.
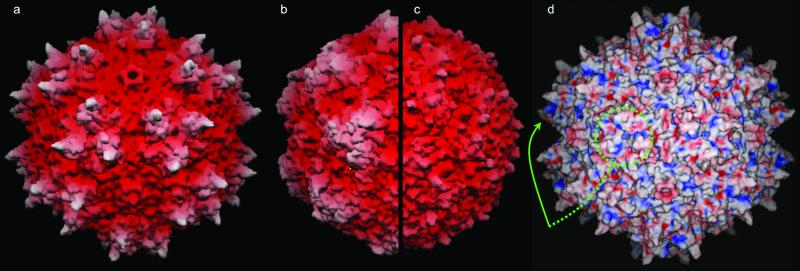
Surface topology and electrostatics. (a–c) show grasp (67) surface renderings of AAV-2, canine parvovirus, and the insect densovirus, respectively, drawn to scale, and colored according to distance from the viral center. The view is down a twofold axis (center of the virus) with threefolds left and right of center, fivefolds above and below (see Fig. 4b). (d) shows the electrostatic surface potential of AAV-2 calculated with spock (68) running from −10 (red) to +10 (blue). The putative receptor-binding sites are positively charged patches on the side of each threefold-proximal peak, viewed edge-on (arrowed) or head-on where 3 equivalent patches join at each threefold (circled).

