

Abstract
Background
The fundamental way to solve the problems of a Limited interspecific gene pool, poor stress resistance, and low yield in Chinese eucalypt plantations is to use the Heterosis derived from the eucalypt gene pool to select new varieties with rich genotypes. In order to reveal the genetic mechanism of the formation of Heterosis in eucalypt growth, based on previous research on the relationship between eucalypt heterosis and parental combining ability, we selected two artificial hybrids 18H167 (T15 × U3423) and 19H74 (U3423 × U6) with significant differences in birth length and similar parental relationships as the research objects.
Results
Transcriptome analysis using RNA-seq technology revealed correlations between gene expression levels that indicated the male parent had a greater impact on the heterosis of eucalypt growth. Based on GO (Gene Ontology) and KEGG (Kyoto Encyclopedia of Genes and Genomes) annotations, GSEA (Gene Set Enrichment Analysis) enrichment and WGCNA (Weighted Gene Co-expression Network Analysis) analysis identified 6 pathways and 8 Hub genes. The biological functions of these pathways involve resistance ability, mainly summarized as ribosomal subunits, extracellular regulatory mechanisms, and three amino acid synthesis pathways. We believe that one or several genes with altered expression levels in candidate pathways, either individually or in combination, directly regulate the growth of eucalypt or indirectly affect growth through adaptation to environmental stress. AS (Alternative Splicing) analysis showed that the AS events of the two hybrids were significantly higher than those of their parents, with SE (Skipped Exon) events possibly being related to growth disadvantages and RI (Retained Intron) events more likely to be related to growth advantages.
Conclusions
This study provides a more in-depth exploration of the formation mechanism of heterosis in eucalypt growth and adds Python code to speed up the process, which are expected to guide the selection of parents in eucalypt hybrid breeding. The discovery of genetic mechanisms of heterosis related to growth provides genetic information for eucalypt genome annotation and molecular marker assisted breeding.
Supplementary Information
The online version contains supplementary material available at 10.1186/s12864-025-12077-9.
Keywords: Eucalypt hybrid, Heterosis, Enrichment analysis, WGCNA
Background
Eucalypt is native to Australia and Surrounding areas and is one of the most important fast-growing timber species worldwide. It has been widely introduced in tropical, Subtropical, and some temperate regions. According to statistics, the global area of eucalypt plantations has exceeded 20 million hectares, with China, Brazil, India and other countries being the main planting countries [1]. Eucalypt wood has long fibers and uniform texture, making it a high-quality raw material for fiberboard and papermaking industries. At the same time, its high biomass characteristics make it an important source of biomass energy. In addition, eucalypt has strong drought resistance and soil adaptability, which can be used for ecological restoration of degraded land [2].
Currently, large-scale monoculture afforestation in Chinese eucalypt plantations is a persistent issue, along with associated problems such as variety degradation, reduced productivity, and diminished stress resistance. The development and promotion of superior eucalypt varieties with diverse genotypes is the primary strategy for addressing these challenges. Given that the genetic transformation system for eucalypt in China remains in its nascent stages, conventional artificial hybridization continues to be the most effective approach for breeding novel eucalypt varieties. The effective exploitation of heterosis is crucial for the success of hybrid breeding programs.
Heterosis refers to the phenomenon in which the first generation (F1) of a hybrid is superior to its parents in biological traits such as growth, reproductive capacity, stress resistance, or yield. Heterosis has been widely applied in crops such as corn and rice. In the genetic improvement of new forest tree varieties, heterosis also has value. For example, hybrids of Populus, Pinus, and Eucalypt often exhibit faster growth rates, higher wood yields, and stronger environmental adaptability [3]. China has achieved significant results in the research of eucalypt hybrid breeding and the development and application of new varieties, such as the (E. urophylla×E. grandis) hybrid which exhibits significant growth advantages in the South China region [4]. However, compared with field crops, the molecular genetic mechanism of forest heterosis remains underexplored, mainly due to the long generation cycle, complex genetic background, and lack of efficient molecular breeding technologies for tree species [5]. Concurrently, eucalypt represents an introduced species within the Chinese context, characterized by a comparatively limited scope of genetic research. Furthermore, the challenges associated with establishing extensive hybrid populations have resulted in a paucity of reports elucidating the genetic underpinnings of heterosis in eucalypt at the omics level. Consequently, a comprehensive investigation into the genetic basis of heterosis in eucalypt is of paramount importance for expediting the selection of superior varieties and enhancing the productivity of artificial forests.
In classical genetics, the genetic mechanisms hypothesized to contribute to heterosis in plants include dominance, overdominance, and epistasis. In addition, many studies have shown that it may be related to factors such as allele complementarity, gene expression regulation changes [6], epigenetic modifications [7], and metabolic pathway optimization [3]. In recent years, with the development of high-throughput sequencing technology, transcriptome sequencing (RNA-seq) has become an important tool for studying heterosis, which can systematically analyze gene expression differences, AS (alternative splicing), ASE (alternative splicing exons), and co-expression networks between hybrids and their corresponding parents.
In forest trees, transcriptome analysis has been used to reveal key genes and pathways related to poplar heterosis, such as differential expression of auxin signaling, cell division, and secondary wall synthesis related genes [8]. However, there is still limited research on the molecular mechanisms contributing to eucalypt heterosis, especially how the gene expression patterns of different hybrid combinations affect growth traits.
Our research team initiated an investigation into the formation mechanism of eucalypt growth heterosis, focusing on the interplay between parental combining ability, heterosis, and the additive and non-additive genetic architectures of growth traits across diverse parental combinations [9]. Despite this, the genetic underpinnings of heterosis in eucalypt growth disparities remained unexplored at the mechanistic level. Consequently, building upon the established correlation between parental combining ability and hybrid growth heterosis [9], this study selected two hybrids exhibiting significant differences in heterosis for growth traits and identified their respective parents. Employing transcriptome sequencing, we analyzed the relationship between gene differential expression and heterosis across parental and hybrid lines, as well as between two hybrid species with significant growth differences, to identify functional genes and pathways associated with growth differences in eucalypt. This approach aims to elucidate the genetic basis of eucalypt heterosis and identify candidate genes related to growth differences, providing valuable genetic information for molecular marker-assisted selection breeding in eucalypt, thereby enriching the theoretical framework of eucalypt hybrid breeding and helping to refine breeding strategies.
Materials and methods
Experimental design and sampling
Five phenotypic traits, including HT (Height), DBH (Diameter at Breast Height), and VOL (Relative Volume) as the main growth traits and SUR (Survival Rate) and SS (Stem Straightness) as the secondary quality traits, were used as the measurement criteria for the heterosis of eucalypt growth [9]. As is well known, Eucalyptus urophylla × Eucalyptus grandis in China has good fast-growing properties, while Eucalyptus urophylla × Eucalyptus tereticornis and Eucalyptus tereticornis × Eucalyptus urophylla have both good fast-growing properties and wind resistance. In accordance with previous research results [9], the selection of genetic materials in this study was based on two principles: (1) The difference in heterosis (i.e., the combining ability and heterotic potential of eucalypt hybrids’ parents) is significant; (2) The genetic relationship between the selected hybrids’ parents was similar, which could be achieved by having a similar pedigree. Based on this, a hybrid with commercially Superior growth characteristics, 18H167 (T15 × U3423), and a hybrid with commercially inferior growth characteristics, 19H74 (U3423 × U6), were selected (Table 1). Leaf tissue was collected from three different individuals of the same variety to obtain three biological replicates for each of the three parents and two hybrids. Transcriptome analysis was conducted on five pairs of comparisons (a: H74 vs. U6; b: H74 vs. U3423; c: H167 vs. H74; d: H167 vs. T15; e: H167 vs. U3423). It must be noted that the A vs. B design of this experiment defaults to A as the control group and B as the comparison group.
Table 1.
Hybrids’ growth situations and their parental information used in this study
| Hybrids | Growth | Female | Species | Male | Species |
|---|---|---|---|---|---|
| 18H167 | excellent | T15 | E.tereticornis | U3423 | E.urophylla |
| 19H74 | inferior | U3423 | E.urophylla | U6 | E.urophylla×E.tereticornis |
RNA-seq
Quality control and sequence alignment
The extracted mRNA (Trizol kit) was enriched using mRNA Capture Beads (BeyoMag™ Oligo(dT)25 Magnetic Beads, Beyotime Biotechnology, Cat# R0075-20 ml; Magnetic Separation Rack, Life Technologies 12321D). After purification with beads, the mRNA was fragmented using high temperatures. The fragmented mRNA was then used as a template to synthesize the first strand of cDNA in a reverse transcription enzyme mixture system (PreScript III RT ProMix for qPCR, Guangzhou EnzyValley Biotechnology Co., Ltd., Cat# R420). While synthesizing the second strand of cDNA, end repair and A-tailing were completed. Next, adapters were ligated, and Hieff NGS® DNA Selection Beads (Hieff NGS® Ultima Dual-mode mRNA Library Prep Kit, 12309ES, Yeasen) were used for purification to select target fragments. PCR library amplification (New England Biolabs Inc., Cat# E7645S) was then performed, and finally, detection was carried out using the Illumina Novaseq X Plus. Fastp [10] (version 0.18.0) further filtered reads. Reads containing adapters and more than 10% of unknown nucleotides(N), and low quality reads containing more than 50% of low quality (Qvalue ≤ 20) bases were removed. The short read alignment tool Bowtie2 [11] (version 2.2.8) was used to map reads to the ribosome RNA (rRNA) database. The rRNA mapped reads then will be removed. The remaining clean reads were further used in assembly and gene abundance calculation. An index of the reference genome was built (version ncbi_id_58726), and cleaned paired-end reads were mapped to the reference genome using HISAT2 2.1.0 [12]. Any remaining parameters were default settings (Figure S1). Genes were classified as novel if they had not been included in the reference genome. Sequenced_Refer_Genes (%) refers to the total number and percentage of Referr_Genes detected in the sequencing results. Sequenced_Novel_Genes(%) refers to the total number and percentage of Novel Genes detected in the sequencing results. The mapped reads from each sample were reconstructed into transcripts using StringTie v1.3.1 [13] [14](Figure S2) [15]. An FPKM (Fragment Per Kilobase of transcript per Million mapped reads) value was calculated using RSEM (RNA-Seq by Expectation-Maximization) [16] software.
Sample relationship analysis and enrichment analysis
PCA (Principal Component Analysis) was performed with the R package gmodels (Version 2.19.1) [17]. Differential expression analysis was performed between two different genotypes using DESeq2 (Version 1.48.1) [18] software (and between two samples using edgeR [19]) (Version Bioconductor 3.21) (Table S1). The genes/transcripts with an FDR (False Discovery Rate) below 0.05 and absolute fold change ≥ 2 were considered differentially expressed genes/transcripts. A hypergeometic test was used to identify significantly enriched GO (2024-11-03) [20] (http://www.geneontology.org/)/KEGG (2024-10-01) [21] terms in DEG (Differentially Expressed Gene) lists/outputs relative to the whole eucalypt background genome. GSEA (Version GSEA-P software) and MSigDB (Version 1.0) [22] software were used to identify specific GO terms/KEGG pathways that were significantly enriched in one of two genotypes in a comparison.
Splicing variants and mutation calling
Bcftools (BCFtools package) [23] was used for calling variants of transcripts, and ANNOVAR (2024-10-14) was used for SNP (Single Nucleotide Polymorphism)/InDel annotation. Hereafter, the phrase RNA editing is used to describe any mRNA sequence variants that were discovered using these tools. Density plots of editing ratios were used to visualize sample-specific editing heterogeneity, including modal editing ratios and distribution shapes. Boxplots were used to depict modal editing ratios across biological replicates and identify genotypes exhibiting unstable RNA editing frequencies [24, 25].The software rMATS [26] (version 4.0.1) (http://rnaseq-mats.sourceforge.net/index.html) was used to identify AS events and analyze differential AS events between samples (Figure S3). PPI (Protein Protein Interaction) networks were identified using String v10 [27]. The network file was visualized using Cytoscape (v3.7.1) software.
WGCNA
Co-expression networks were constructed using the WGCNA (v1.47) package in R [28]. Differential gene expression values were imported into WGCNA to construct co-expression modules using the automatic network construction function blockwiseModules. Genes with high Kin (Intramodular connectivity) and MM (Module correlation degree) were considered to be hub genes which might have important functions. Pearson’s correlation coefficients were calculated between each gene and the growth trait data from the plants as well as GS (Gene Significance) values were obtained. Finally, GO and KEGG pathway enrichment analysis were conducted to analyze the biological functions of the modules.
Identification of gene sets related to growth differences in eucalypt
In these genotypes, common differential gene pathways were hypothesized to be associated with the genetic mechanisms contributing to heterosis for growth-related traits in eucalypt hybrids. Differential gene pathways identified in all five comparisons were higher priority for analysis than pathways identified in four comparisons, pathways found in four comparisons were of higher priority than those found in three comparisons, and so on. Pathways with the same priority level were considered more likely to be associated with growth differences if the highest differential expression levels were discovered between the genotypes with the greatest differences in growth habits, namely H167 vs. H74 (i.e., comparison 1). Then, common differentially expressed gene pathways were ranked second if they were identified in both the H167 vs. U3423 and H74 vs. U3423 comparisons (i.e., comparison 2),. Next, since it was believed that the differentially expressed genes between the male parent and the hybrid had a stronger correlation with growth heterosis, pathways identified in the H74 vs. U6 comparison were ranked third (i.e., comparison 3), and the H167 vs. T15 comparison was ranked fourth (i.e., comparison 4).
GO and KEGG enrichment analysis suggested that results with a Qvalue ≤ 0.05 were statistically significant. It is generally believed that the results with | NES |>1, NOM p-val < 0.05, and FDR q-val (Qvalue) < 0.25 [3] can be used to identify biologically meaningful GSEA results. Therefore, the top 20 GO terms (GO enrichment) and pathways (KEGG enrichment) with the smallest Qvalue, as well as the top 20 pathways with the largest |NES| (GSEA enrichment) were selected. For GO enrichment, all genes including homologs were extracted. For the pathways screened using KEGG enrichment and GSEA-KEGG enrichment software, candidate genes were inversely identified based on significantly gene products enriched KEGG/GSEA-KEGG terms. For the GSEA-GO enrichment term, the genes from the leading-edge subset were compared with the results of the GO enrichment analysis. It should be noted that the statistically significant p-values in this study were relative. Taking into account the p-values of all the modules, modules with p ≤ 0.1 were considered to be significantly associated with the phenotypic trait data. The genes mentioned above, together with the hub genes identified using WGCNA, were defined as the preliminary target gene set of this study. Finally, PPI network analysis was conducted to select the protein-coding genes with the strongest connectivity scores as target genes for future studies of genetic mechanisms of heterosis for growth traits in H167 vs. H74, set since DEGs between the two hybrids were considered the most relevant to the mechanism.
Concentrating DEG sets as much as possible could encourage more precise breeding efforts. Thus, Python code was designed that improves the accuracy and efficiency of screening for DEGs. Code 1 (‘Cross column duplicate filtering’) was used to count the common differential pathways and gene products [up-regulated proteins (enzymes) or metabolites] that appeared more than twice in five pairs of comparisons. Code 2 (’Qvalue search on demand’) was used to detect significant Qvalues (i.e., significantly enriched genes). Code 3 (’Merge with 3 decimal places retained’) was used to truncate Qvalues to 3 decimal places, providing a cleaner output. Code 4 (’Delete duplicate values’) was used to delete duplicate genes in the target gene column and retain unique values.
Results
Preparation of preliminary data
In all samples, the proportion of clean reads was higher than 99.5% (Table S2), the proportion of reads with a Q (quality) score greater than or equal to 20 (i.e., Q20) was higher than 95.34% (Table S3), and the proportion of reads aligning to ribosomal sequences was less than 2.11% (Table S4). Therefore, the sequencing quality of this study was reasonable. Of the reads that aligned to the reference genome (Table S5), the proportion of sequencing reads that aligned to exon regions for all samples was above 87.20% (Table S6), indicating a relatively complete reference genome. This study identified transcripts that map to novel genes in the genome (Table S7). Generally, the amount of sequenced_Refer_Genes was higher than 64.19%, and the amount of sequenced_Novel_Genes was higher than 68.02% (Table S8), also indicating a relatively complete reference genome. Among all samples, the genes with gene coverage ranging from 80 to 100% were the most common, accounting for over 65.16% of all genes identified (Figure S4). When the sequencing depth reached 30 reads (× 1000000), the number of genes detected in five samples tended to be saturated (Figure S5). Sequencing saturation indicated that subsequent research could continue.
Sample relationship analysis
Based on the TPM values of each gene (Table S9), the gene abundance was highest when log10 (TPM) was 1–2, and there was only one peak in gene abundance for each sample (Fig. 1Aa). Across the samples, the median log10 (TPM) values were similar (horizontal lines ≈ 1.5–2.0). However, all three replicates of genotype T15 displayed narrower upper-quartile ranges (shorter top whiskers), which might indicate technical bias in long-transcript capture (e.g., due to RNA fragmentation during library preparation) (Fig. 1 Ab). All downstream analyses (DEGs, heatmap) utilized gene-length-adjusted TPM and DESeq2 normalization to mitigate such biases. Therefore, the biological differences observed in Fig. 1Bb and DEG analyses were considered valid.
Fig. 1.

Gene expression and sample relationship analysis (Note: A: Gene expression distribution. a: Gene expression abundance distribution plot (The X-axis in the figure is log10 (TPM), the Y-axis represents the abundance of genes.); b: Violin plot of gene expression levels. B: Sample relationship analysis. a: PCA of Samples; b: Sample correlation heatmap.)
The expression levels of the three parents remained relatively stable across the replicates (Fig. 1B). PCA revealed distinct clustering patterns among genotypes, with the first two principal components accounting for 90.5% of the total variance. H167 and H74 exhibited tight intra-group clustering, forming spatially separated clusters along the PC1. T15, U6, and U3423 occupied peripheral positions distinct from hybrids (PC1, PC2). It implied that there were differences in transcriptome levels between parents and hybrids, as well as between the two hybrids. The pronounced separation between H167 and H74 highlighted their phenotypic divergence (PC2). On the PCA plot, H167 clustered more closely with the common parent of the two hybrids, U3423 (male), than with its other parent, T15 (female) (Fig. 1Ba). Similarly, the correlation between H74 and the male parent U6 was much higher than its correlation with the female parent U3423 (Fig. 1Bb). Therefore, we preliminarily speculated that the exceptional growth of the elite parent U3423 was more likely to be inherited by its hybrid progeny.
There were a maximum of 5157 DEGs between H167 and T15. There were 4460 differentially down-regulated genes between H74 and U3423 (Figure S6a), significantly higher than among the other comparisons. Since there were more DEGs between the female parent and the hybrid, genes related to eucalypt growth differences were narrowed down using the DEGs between the male parent and the hybrid. There were many genes that were significantly differentially expressed between H74 and U6 (Figure S6b-f). The gene expression patterns in each comparison in this study were similar, and the differences in expression levels were also significant (Figure S7). This indicated that it was feasible to search for genes related to differences in eucalypt growth by comparing gene expression patterns.
Enrichment analysis
Due to the limitations of gene expression analysis in characterizing the biological relevance of differentially expressed genes, enrichment analysis was used to explore the genetic mechanisms of heterosis. Through GO enrichment analysis, it was determined that four DEG pathways were shared by H167 vs. H74, H167 vs. T15, H167 vs. U3423, and H74 vs. U3423, namely ‘extracellular region’ (GO: 0005576), ‘external encapsulating structure’ (GO: 0030312), and ‘cell periphery’ (GO: 0071944). The Qvalue of the three GO pathways was 0.0 (α = 0.05). Through KEGG enrichment analysis, it was found that there were three DEG pathways shared by the four comparisons, but the Qvalues of KO00909 and KO00061 were 0.10411 and 0.356548, respectively, which did not satisfy the Qvalue threshold of 0.05. Therefore, one KEGG pathway ‘Plant-parent interaction’ (KO04626) was selected, with Qvalue = 0.091886 (α = 0.05) (Fig. 2; Table 2; Figure S8-10). Figure 2 is a partial display of the enrichment circle diagram, and the complete enrichment circle diagram can be found in Figure S8.
Fig. 2.

Enrichment circle diagram (Note: The manuscript image only shows one comparison, H167 vs. H74. a: GO; b: KEGG. First circle: The 20 most enriched GO terms/KEGG pathways, and outside the circle is the coordinate ruler of the number of DEGs. Different colors represent different GO terms/KEGG pathways; Second circle: The number and Qvalue of the GO terms/KEGG pathways in the differential gene background. The more differential gene backgrounds there are, the longer the bars, and the smaller the Qvalue, the redder the color; Third circle: Bar chart of the proportion of up-regulated and down-regulated DEGs, with dark purple representing the proportion of up-regulated DEGs and light purple representing the proportion of down-regulated DEGs; The specific numerical values are displayed below; Fourth circle: RichFactor values (the number of differentially expressed genes was divided by the total number of genes) for each GO term/KEGG pathway. Each Line on the grid represents 0.1.)
Table 2.
Common DEG pathways among 5 comparisons in GO and KEGG enrichment analysis
| Enrichment method | Comparison | Common ID (Qvalue) |
|---|---|---|
| GO | H167 vs. T15,H74 vs. U6 | GO:0016301(0.000),GO:0016310(0.000) |
| H167 vs. H74,H167 vs. T15,H74 vs. U6 | GO:0004672(0.000),GO:0016773(0.000) | |
| H167 vs. U3423,H74 vs. U6 | GO:0001101(0.000),GO:0010243(0.000) | |
| H167 vs. H74,H74 vs. U6 | GO:0005524(0.007),GO:0008270(0.006),GO:0032555(0.006),GO:0035639(0.006) | |
| H167 vs. H74,H167 vs. T15,H167 vs. U3423,H74 vs. U3423 | GO:0005576(0.000),GO:0030312(0.000),GO:0071944(0.000) | |
| H167 vs. U3423,H74 vs. U3423 | GO:0009698(0.000),GO:0009832(0.000),GO:0016020(0.000),GO:0042546(0.000),GO:0071554(0.000) | |
| H167 vs. H74,H167 vs. T15 | GO:0016772(0.000) | |
| KEGG | H167 vs. U3423,H74 vs. U3423,H74 vs. U6 | KO00940(0.000),KO00941(0.042),KO01100(0.000),KO01110(0.000) |
| H167 vs. H74,H167 vs. T15,H167 vs. U3423,H74 vs. U6 | KO04626(0.092) | |
| H167 vs. H74,H167 vs. U3423,H74 vs. U3423,H74 vs. U6 | KO00909(0.104) | |
| H167 vs. T15,H167 vs. U3423,H74 vs. U3423,H74 vs. U6 | KO04075(0.018) | |
| H167 vs. U3423,H74 vs. U6 | KO04016(0.222) | |
| H167 vs. H74,H167 vs. T15,H74 vs. U3423,H74 vs. U6 | KO00780(0.438) | |
| H167 vs. H74,H74 vs. U6 | KO01040(0.845) | |
| H74 vs. U3423,H74 vs. U6 | KO00400(0.001),KO00910(0.327) | |
| H167 vs. H74,H74 vs. U3423,H74 vs. U6 | KO00944(0.196) | |
| H167 vs. T15,H167 vs. U3423,H74 vs. U6 | KO00062(0.222) | |
| H167 vs. U3423,H74 vs. U3423 | KO00360(0.222),KO00520(0.261),KO00900(0.050),KO00902(0.042) | |
| H167 vs. H74,H167 vs. T15,H167 vs. U3423,H74 vs. U3423 | KO00061(0.357) | |
| H167 vs. H74,H167 vs. U3423,H74 vs. U3423 | KO00500(0.313),KO01212(0.357) | |
| H167 vs. H74,H167 vs. T15,H74 vs. U3423 | KO00052(0.056) | |
| H167 vs. H74,H167 vs. T15 | KO00511(1.000),KO00531(0.730) | |
| H167 vs. T15,H167 vs. U3423 | KO00010(0.216),KO00480(0.010),KO02010(0.313) |
To identify the 20 GO terms/KEGG pathways with the largest absolute Qvalue from each comparison, code 1 was used to find any GO terms/KEGG pathways (column 3: Common ID) that appeared more than twice in five pairs of comparisons and all their corresponding comparisons (column 2: Comparison). Code 2 and code 3 were used to calculate the corresponding Qvalue of the GO term/KEGG pathway (column 3: Common ID (Qvalue))
For the GSEA-GO analysis results, the DEG pathways ‘large ribosomal subunit’ (GO: 0015934) (Fig. 3a) and ‘ribosomal subunit’ (GO: 0044391) (Fig. 3b) were found in four comparisons, H167 vs. H74, H167 vs T15, H167 vs U3423, and H74 vs. U3423, both of which satisfied FDR q-val < 0.25. However, among all five comparisons, the GSEA-KEGG analysis revealed only one shared pathway, ‘Spliceosome’ (KO03040) (Fig. 3d), that satisfied FDR q-val < 0.25 (Table 3). Therefore, pathways that were significant in four of the comparisons, H167 vs. H74, H167 vs. U3423, H74 vs. U3423, H74 vs U6, were also considered. These four comparisons shared a differential gene pathway ‘Phenyalalanine, tyrosine and tryptophan biosynthesis’ (KO00400) (Fig. 3c) that satisfied FDR q-val < 0.25 (Table 2). Figure 3 was a partial display of the GSEA diagram, and the complete GSEA diagram could be found in Figure S11.
Fig. 3.

GSEA enrichment score diagram (Note: The manuscript image only shows one comparison, H167 vs. H74. a: GO:0015934; b: GO:0044391; c: KO00400; d: KO03040. Top: from left to right, enrichment scores for each gene, represented as a continuous line. Medium: each line represents a gene in the gene set and its ranking position in the gene list. Below: matrix of gene phenotype association, red is highly expressed in H167, and blue is highly expressed in H74.)
Table 3.
Common DEG pathways among 5 comparisons in GSEA
| Gene set | Comparison | Common ID (Qvalue) |
|---|---|---|
| GO | H167 vs. U3423,H74 vs. U6 | GO:0000785(0.130) |
| H167 vs. H74,H74 vs. U6 | GO:0004521(0.457),GO:0004540(0.864),GO:0015149(0.427),GO:0015665(0.740),GO:0016893(0.478),GO:0043473(0.467),GO:0043476(0.461),GO:0043478(0.468),GO:0043479(0.468),GO:0043480(0.466),GO:1,901,618(0.732) | |
| H167 vs. H74,H74 vs. U3423,H74 vs. U6 | GO:0004523(0.443),GO:0016891(0.435) | |
| H74 vs. U3423,H74 vs. U6 | GO:0034728(0.181) | |
| H167 vs. T15,H74 vs. U3423 | GO:0005198(0.475),GO:0006220(0.161),GO:0006221(0.144),GO:0015926(0.269),GO:0051168(0.444),GO:0072527(0.314) | |
| H167 vs. H74,H167 vs. U3423,H74 vs. U3423 | GO:0005618(0.016),GO:0031225(0.002) | |
| H167 vs. H74,H167 vs. T15,H74 vs. U3423 | GO:0005840(0.179),GO:0072528(0.387) | |
| H167 vs. U3423,H74 vs. U3423 | GO:0006364(0.072),GO:0008033(0.149),GO:0009451(0.060),GO:0009698(0.022),GO:0009699(0.016),GO:0009808(0.001),GO:0016298(0.013),GO:0016679(0.001),GO:0034470(0.068),GO:0042254(0.057),GO:0046992(0.014),GO:0046993(0.028) | |
| H167 vs. H74,H74 vs. U3423 | GO:0009637(0.294) | |
| H167 vs. T15,H167 vs. U3423,H74 vs. U3423 | GO:0009832(0.000),GO:0016682(0.000),GO:0022613(0.157),GO:0042546(0.001) | |
| H167 vs. H74,H167 vs. T15,H167 vs. U3423,H74 vs. U3423 | GO:0015934(0.166),GO:0044391(0.087) | |
| H167 vs. T15,H167 vs. U3423 | GO:0008375(0.135),GO:0015935(0.093) | |
| KEGG | H167 vs. U3423,H74 vs. U3423,H74 vs. U6 | KO00062(0.210),KO00330(0.433),KO00520(0.079),KO00945(0.023) |
| H167 vs. T15,H167 vs. U3423,H74 vs. U3423,H74 vs. U6 | KO00073(0.110),KO00510(0.111),KO00513(0.134),KO00940(0.028),KO00941(0.000),KO03008(0.016),KO03013(0.215) | |
| H167 vs. H74,H167 vs. T15,H167 vs. U3423,H74 vs. U6 | KO00195(0.111) | |
| H167 vs. H74,H167 vs. T15,H74 vs. U6 | KO00196(0.991),KO03410(1.000) | |
| H167 vs. H74,H74 vs. U6 | KO00230(1.000),KO00350(0.923),KO00903(0.979),KO03050(0.969) | |
| H74 vs. U3423,H74 vs. U6 | KO00250(0.980) | |
| H167 vs. H74,H167 vs. U3423,H74 vs. U3423,H74 vs. U6 | KO00400(0.045) | |
| H167 vs. T15,H74 vs. U6 | KO00500(0.983) | |
| H167 vs. H74,H167 vs. T15,H74 vs. U3423,H74 vs. U6 | KO00904(0.940) | |
| H167 vs. U3423,H74 vs. U6 | KO00909(0.411),KO03450(0.424) | |
| H167 vs. T15,H167 vs. U3423,H74 vs. U6 | KO03015(0.681) | |
| H167 vs. T15,H74 vs. U3423,H74 vs. U6 | KO03022(0.845) | |
| H167 vs. H74,H167 vs. T15,H167 vs. U3423,H74 vs. U3423,H74 vs. U6 | KO03030(0.253),KO03040(0.181) | |
| H167 vs. H74,H167 vs. U3423,H74 vs. U3423 | KO00040(0.054),KO00900(0.270),KO03060(0.927),KO04141(0.437) | |
| H167 vs. T15,H74 vs. U3423 | KO00052(0.560),KO00561(0.723),KO00860(0.989) | |
| H167 vs. H74,H74 vs. U3423 | KO00053(0.960) | |
| H167 vs. H74,H167 vs. T15,H74 vs. U3423 | KO00300(1.000),KO00565(0.410) | |
| H167 vs. T15,H167 vs. U3423,H74 vs. U3423 | KO00600(0.222),KO00630(0.410),KO00910(0.562),KO03020(0.058) | |
| H167 vs. U3423,H74 vs. U3423 | KO00770(0.132),KO00908(0.410),KO04145(0.099) | |
| H167 vs. H74,H167 vs. T15,H167 vs. U3423,H74 vs. U3423 | KO03010(0.005) | |
| H167 vs. H74,H167 vs. U3423 | KO00360(0.036),KO00514(0.340),KO00950(0.421),KO00960(0.226) | |
| H167 vs. H74,H167 vs. T15 | KO00531(0.990),KO00563(0.807),KO00920(1.000) | |
| H167 vs. H74,H167 vs. T15,H167 vs. U3423 | KO00902(0.429) |
To identify the 20 GO terms/KEGG pathways with the largest absolute value of NES for each comparison, code 1 was used to find any GO terms/KEGG pathways (column 3: Common ID) that appear more than twice in five pairs of comparisons and all their corresponding comparisons (column 2: Comparison). Code 2 and code 3 were used to calculate the corresponding Qvalue (FDR q-val) of the GO term/KEGG pathway (column 3: Common ID (Qvalue))
It was interesting to note that by extracting the intersection of the leading-edge subset and GO enriched genes in the two pathways ‘large ribosomal subunit’ (GO:0015934) and ‘ribosomal subunit’ (GO:0044391) obtained by GSEA-GO analysis (Fig. 3), only one gene, ncbi_104422945, could be obtained. It was a high confidence target, and the first Hub gene in this study. Summarizing the results of GO, KEGG, and GSEA enrichment analysis, six gene sets and one Hub gene (ncbi_104422945) related to the genetic mechanism of heterosis growth were identified.
For the three KEGG gene sets, in the ‘Plant-parent interaction’ (KO04626) pathway diagram, it was found that the four comparisons shared the differential gene product CDPK, CaMCML, EDS1,MPK3/6,RPS2 (Table 4). The differences in RPS2 were consistent among the four comparisons. Relative to H167, CDPK and CaMCML in H74 were significantly up-regulated. Compared to H74, CaMCML in U6 showed significant down-regulation, while CDPK showed significant changes (both up-regulated and down-regulation). Compared to H167, there were significant changes (both up-regulated and down-regulation) in CDPK and CaMCML in the parents of H167. This might indicate that they were related to heterosis for growth-related traits. EDS1 expression in the male parents relative to its hybrids was down-regulated, and the EDS1 expression level of H74 was higher than that of H167. Compared to H167, MPK3/6 in U3423 showed a significant up-regulation. The expression level of MPK3/6 of H74 was higher than that of H167 (Figure S12A). In the ‘Phenylalanine, tyrosine and tryptophan biosynthesis’ (KO00400) pathway diagram, it was found that the only common differential gene product among the four comparisons was 2.6.1.5 (enzyme EC number), namely TAT and ARO8 (Table 4). In addition to being up-regulated in the female parent of H74, it was down regulated in the parents of H167, and the expression levels of TAT and ARO8 in H74 were also lower than those in H167 (Figure S12B). In the ‘Splicosome’ (KO03040) pathway diagram, it was found that the only common differential gene product among the five comparisons was the protein complex LSM (Table 4), which was located in the U4/U6 complex. Crucially, the expression level of LSM in H74 parents decreased while the expression level of LSM was higher in H74 relative to H167. This might indicate a strong correlation between LSM expression levels and growth differences. Secondly, according to our priority principle mentioned earlier, the SF3a and eIFA3 proteins shared by the four comparisons might also be particularly critical (Table 4), which were located in the U2 and EJC/TREX complexes, respectively (Figure S12C).
Table 4.
Common DEG products among 5 comparisons in 3 KEGG pathway
| KEGG Pathway | Comparison | Common gene product |
|---|---|---|
| Plant-pathogen interaction (KO04626) | H167 vs. T15,H167 vs. U3423,H74 vs. U6 | BAK1BKK1,CNGCs, FLS2,KCS1/10,PR1,Pti5,RIN4,RPM1,WRKY2533 |
| H167 vs. H74,H167 vs. T15,H167 vs. U3423,H74 vs. U6 | CDPK, CaMCML, EDS1,MPK3/6,RPS2 | |
| H167 vs. H74,H167 vs. U3423 | SGT1 | |
| Phenylalanine, tyrosine and tryptophan biosynthesis (KO00400) | H167 vs. U3423,H74 vs. U3423,H74 vs. U6 | 1.1.1.25,2.5.1.54,2.6.1.9,4.2.1.10,4.2.1.51,4.2.1.91 |
| H74 vs. U3423,H74 vs. U6 | 2.6.1.1,4.2.1.20 | |
| H167 vs. H74,H167 vs. U3423,H74 vs. U3423,H74 vs. U6 | 2.6.1.5 | |
| H167 vs. U3423,H74 vs. U3423 | 2.7.1.71,4.1.3.27,5.4.99.5 | |
| Spliceosome (KO03040) | H167 vs. H74,H167 vs. T15,H167 vs. U3423,H74 vs. U3423,H74 vs. U6 | LSM |
| H167 vs. H74,H167 vs. U3423,H74 vs. U3423,H74 vs. U6 | SF3a, eIFA3 | |
| H167 vs. H74,H167 vs. T15,H167 vs. U3423,H74 vs. U6 | Snu66 | |
| H167 vs. T15,H167 vs. U3423,H74 vs. U3423,H74 vs. U6 | SR | |
| H167 vs. T15,H167 vs. U3423,H74 vs. U6 | HSP73 | |
| H167 vs. U3423,H74 vs. U3423 | THOC | |
| H167 vs. T15,H167 vs. U3423 | PRL1 |
Gene products belonging to specific KEGG pathways (column 1: KEGG Pathway) were counted. Code 1 was used to count the common differential gene products (column 3: Common gene product) that appear more than twice in five pairs of comparisons and all their corresponding comparisons (column 2: Comparison)
Mutation analysis
The trends of SNP and InDel statistics from RNA editing classification analysis for all samples were almost the same (Figure S13), and mutations would not significantly affect the screening of DEGs in the previous Sect. [23]. There were significant differences in the RNA editing frequencies of the three biological replicates of H74. However, the RNA editing frequency of the other four genotypes remained relatively stable with the change of editing ratio across the three biological replicates showing a normal distribution with a mode of 0.5 (Fig. 4). This might indicate uncertain variations in the modification and processing of post transcriptional mature RNA molecules in the growth disadvantaged hybrid. It might also indicate that dominant growth genes have genetic stability. For future studies, it is recommended that RNA editing frequencies be examined cautiously if in the study has three or fewer biological replicates.
Fig. 4.
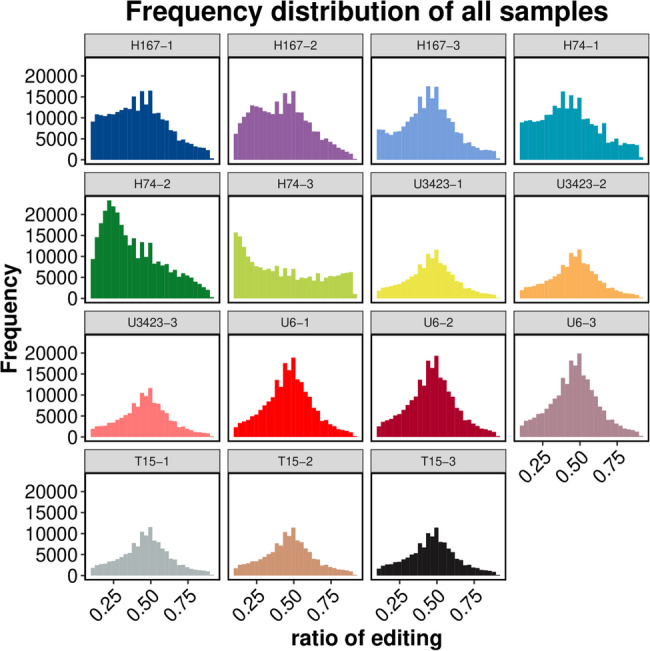
Statistical chart of RNA editing frequency following removal of low-quality SNPs and SNPs near indels
AS analysis
Two hybrids had more AS variants numbers than the parents, and the heterosis might come from AS variants (Figure S14). The JC (the number of Exon Skipping Isoform reads from target and junction sites) between H74 and U6 was the highest, and the number of AS variants of every type was also the highest between these two genotypes. The number of AS variants between H167 and U3423 was generally the lowest (Figure S15A). However, H167 vs. H74 had the lowest JCEC (the number of Exon Inclusion Isoform reads from target and junction sites) (Fig. 5b). Among the 5 comparisons, the two most common event types were SE and RI. The comparisons of H74 vs. U6, H74 vs. U3423, and H167 vs. H74 had the highest number of SEs, followed by RIs. H167 vs. T15 and H167 vs. U3423 had the highest number of RIs, followed by SEs (Fig. 5). These findings might indicate that SEs were related to growth disadvantages, while RIs were more likely to be related to growth advantages. Only H167 vs. H74 (Fig. 5) was shown in the main text, and the rest can be found in the supplementary information (Figure S15).
Fig. 5.

Differential AS classification and quantity statistical diagrams showing the number of differentially expressed genes that contained at least one type of alternative splicing (AS) in H167 vs. H74; a: bar plot showing the number of JC transcripts (i.e., exon-skipping isoforms) with containing a type of AS; b: pie chart showing the number of JCEC transcripts (i.e., exon-inclusion isoforms) containing a type of AS
Compared to the female parent, the correlations between the gene expression levels of the two hybrids and the male parents were stronger (Fig. 1Bb), with fewer differentially expressed genes and greater degrees of difference being observed in between the female parents and their hybrids (Figure S6b-f). The differential regulation of gene products EDS1 and MPK3/6 in the male parent of the superior hybrid H167 and the inferior hybrid H74 was the same (Figure S12A), and the numbers of AS in the male parents and hybrids were higher (Figure S15A). Based on the above results, it was speculated that the male parent had a greater impact on the heterosis of hybrid growth.
WGCNA analysis
Based on the five traits related to eucalypt growth, including HT, DBH, SUR, VOL, and SS, the tan module had the strongest correlation with growth. Except for the SS trait which showed a significant positive correlation with the module, all other traits showed a significant negative correlation with it (p < 0.1) (Fig. 6). In addition, the grey60 module had a strong correlation with growth, and the positive and negative correlations between the five growth traits and grey60 were consistent with the tan module (p ≤ 0.1) (Fig. 6). The skyblue module had the strongest and most significant negative correlation with HT among all modules (r2=−0.7; p = 0.004) (Fig. 6). It was worth mentioning that this was consistent with our previous research results [9], which suggested that gene expression might have opposing effects on growth quality and SS.
Fig. 6.

Module trait relation diagram (Note: The horizontal axis represents the trait, and the vertical axis represents the module. The colors of the heatmap correspond to the of Pearson’s correlation coefficients of the modules (the top number in each box) for each trait. Red represents a positive correlation, green represents a negative correlation, darker colors indicate stronger correlations, and the numbers in parentheses below are p-values. The smaller the value, the stronger the significance.)
In the analysis of trait correlation, it was determined that the tan module was highly correlated with growth traits because |GS|>0.8, |Kin|>100, and |MM|>0.9 (Table 5). Accordingly, three hub genes MSTRG.35,350, MSTRG.4104 and ncbi_104443483 were identified (Table 6).
Table 5.
Growth trait related genes in the Tan module
| Gene | GS | GS.pvalue | Kin | MM | |
|---|---|---|---|---|---|
| HT | ncbi_104435039 | −0.807 | 0.00027961 | 63.975 | 0.834 |
| ncbi_104433568 | −0.809 | 0.00026183 | 83.985 | 0.869 | |
| MSTRG.35,350 | −0.821 | 0.000176975 | 135.789 | 0.956 | |
| MSTRG.4104 | −0.821 | 0.000176975 | 135.789 | 0.956 | |
| ncbi_104417067 | −0.824 | 0.000160364 | 54.319 | 0.805 | |
| ncbi_104443483 | −0.830 | 0.00012707 | 103.313 | 0.908 | |
| ncbi_104432758 | −0.861 | 3.83E-05 | 70.148 | 0.845 | |
| ncbi_104448101 | −0.874 | 2.06E-05 | 68.861 | 0.833 | |
| ncbi_104438296 | −0.914 | 1.95E-06 | 74.302 | 0.854 | |
| MSTRG.16,990 | −0.922 | 1.05E-06 | 59.302 | 0.815 | |
| ncbi_104419919 | −0.940 | 2.00E-07 | 54.963 | 0.802 | |
| DBH | ncbi_104435039 | −0.814 | 0.000219944 | 63.975 | 0.834 |
| ncbi_104449238 | −0.846 | 7.03E-05 | 10.338 | 0.554 | |
| VOL | ncbi_104449238 | −0.814 | 0.000218769 | 10.338 | 0.554 |
| SS | ncbi_108959151 | 0.851 | 5.77E-05 | 51.770 | 0.792 |
Table 6.
Genes related to growth differences in Eucalypt
| extracellular region (GO:0005576) | external encapsulating structure (GO:0030312) | cell periphery (GO:0071944) | Plant-pathogen interaction (KO04626) | Phenylalanine, tyrosine and tryptophan biosynthesis (KO00400) | Spliceosome (KO03040) |
|---|---|---|---|---|---|
| ncbi_104456797 | ncbi_104456797 | ncbi_104456797 | ncbi_104432152 | ncbi_104440877 | MSTRG.13,227 |
| ncbi_104456805 | ncbi_104456805 | ncbi_104456805 | ncbi_104450866 | ncbi_104440906 | MSTRG.8529 |
| ncbi_104456301 | ncbi_104414885 | ncbi_104414885 | ncbi_104452309 | ||
| ncbi_104433548 | ncbi_104433548 | MSTRG.1672 | ncbi_104452311 | ||
| ncbi_104433012 | ncbi_104431697 | ncbi_104433548 | ncbi_104429374 | ||
| ncbi_104419266 | ncbi_104436406 | MSTRG.34,138 | ncbi_104448874 | ||
| ncbi_104419267 | ncbi_104431376 | ncbi_104431697 | MSTRG.26,157 | ||
| ncbi_104453907 | ncbi_104444321 | ncbi_104436406 | MSTRG.6764 | ||
| ncbi_104431697 | ncbi_104456905 | ncbi_104452223 | MSTRG.7876 | ||
| ncbi_104436406 | ncbi_104432337 | ncbi_104431376 | ncbi_108956299 | ||
| ncbi_104431376 | ncbi_104454132 | ncbi_104444321 | |||
| ncbi_104444321 | ncbi_104447095 | ncbi_104456905 | |||
| ncbi_104433102 | ncbi_104432337 | ||||
| ncbi_104448866 | ncbi_104454132 | ||||
| ncbi_104447095 | |||||
| ncbi_104440695 | |||||
| ncbi_104440743 |
Analysis revealed that all five growth traits were positively correlated to varying degrees with Kin and MM values (Figure S16). Two of the most critical growth traits, HT and DBH, were the most strongly correlated with the GS, Kin, MM values. This is important when considering that the vast majority of genes clustered near the eigengenes with the highest GS, Kin, and MM values (Figure S16a-b). This further demonstrated the important biological role of the tan module in the differential growth of eucalypt.
All significantly enriched GO terms in the tan module were biological processes (Figure S17a), which was different from our previous GO enrichment of all differentially expressed genes (Fig. 2). The pathways that were significantly enriched according to KEGG were mostly related to ‘Metabolism’ (Figure S17b). More importantly, the significantly enriched KEGG pathways in the tan module were highly consistent with our previous KEGG enrichment results (Figs. 2b and 3d; Tables 2 and 4; Figure S8B-10B, Figure S11D), where ‘Plant-pathogen interaction’ and ‘Spliceosome’ were present in both enrichments. In addition, the most significant GO enrichment pathway captured in the tan module was ‘Response to endogenouous stimulus’ (Pvalue = 2.2811E-10) (Figure S18a), and the most significant KEGG enrichment pathway was ‘Galactose metabolism’ (Qvalue = 0.006965) (Figure S18b). It was found that relative to H167, the proteins corresponding to 2.4.1.123 and 2.4.1.82 were significantly up-regulated in H74 in the ‘Galactose metabolism’ pathway (Figure S19). Finally, three Hub genes nbci_104448375, nbci_104440165 and nbci_104434572, as well as one transcription factor (TF) nbci_104452186 were identified (Figure S20) (Table 6).
All the genes associated with growth trait heterosis in eucalypt are summarized (Table 6). Moreover, target gene PPI network analysis was used to further determine whether genes that were differentially expressed between the high growth hybrid H167 and the low growth hybrid H74 were associated with heterosis for growth traits in eucalypt. This approach revealed no connectivity between the Hub genes. Therefore, the gene with the highest connectivity (connectivity = 10) was identified from 3 GO pathways (Figure S21a-c) and 3 KEGG pathways (Figure S21d-f) as the final target gene for this study. Only the pathway with the most target genes is displayed in the main text (Fig. 7; Table 7). PPI networks containing the remaining target genes are available in the supplementary information (Figure S21; Table S10-14).
Fig. 7.

Target gene PPI network (Cell periphery (GO:0071944); Note: The PPI network of other target genes can be found in Figure S21)
Table 7.
Target gene PPI network gene overview (Cell periphery (GO:0071944))
| Gene1_ID | Gene1_Symbol | Gene2_ID | Gene2_Symbol | combined_score |
|---|---|---|---|---|
| ncbi_104456797 | PARB | ncbi_108953813 | -- | 290 |
| ncbi_104456805 | PARB | ncbi_108953813 | -- | 290 |
| ncbi_104456797 | PARB | ncbi_104449481 | PDR1 | 391 |
| ncbi_104456797 | PARB | MSTRG.34,138 | ABCG32 | 391 |
| ncbi_104456805 | PARB | ncbi_104449481 | PDR1 | 391 |
| ncbi_104456805 | PARB | MSTRG.34,138 | ABCG32 | 391 |
| ncbi_104456797 | PARB | ncbi_104437526 | WAK1 | 262 |
| ncbi_104456805 | PARB | ncbi_104437526 | WAK1 | 262 |
| ncbi_104456797 | PARB | ncbi_104415306 | WRKY72A | 243 |
| ncbi_104456805 | PARB | ncbi_104415306 | WRKY72A | 243 |
| ncbi_104456797 | PARB | ncbi_104444158 | CAD1 | 281 |
| ncbi_104456797 | PARB | MSTRG.12,963 | CAD1 | 281 |
| ncbi_104456805 | PARB | ncbi_104444158 | CAD1 | 281 |
| ncbi_104456805 | PARB | MSTRG.12,963 | CAD1 | 281 |
| ncbi_104456797 | PARB | ncbi_104438660 | RPV1 | 319 |
| ncbi_104456797 | PARB | ncbi_108958096 | RPV1 | 319 |
| ncbi_104456805 | PARB | ncbi_104438660 | RPV1 | 319 |
| ncbi_104456805 | PARB | ncbi_108958096 | RPV1 | 319 |
| ncbi_104456797 | PARB | ncbi_104439706 | WAKL10 | 419 |
| ncbi_104456805 | PARB | ncbi_104439706 | WAKL10 | 419 |
| ncbi_104414885 | GIP2 | ncbi_108960753 | SRC2 | 265 |
| ncbi_104414885 | GIP2 | ncbi_104440013 | WAKL3 | 237 |
| ncbi_104414885 | GIP2 | ncbi_104440040 | WAKL3 | 237 |
| ncbi_104414885 | GIP2 | ncbi_104440045 | WAKL2 | 237 |
| ncbi_104414885 | GIP2 | ncbi_104415772 | UGT85K5 | 243 |
| ncbi_104414885 | GIP2 | ncbi_104429065 | UGT85A24 | 243 |
| ncbi_104414885 | GIP2 | MSTRG.18,982 | At1g56140 | 286 |
| ncbi_104414885 | GIP2 | ncbi_104415306 | WRKY72A | 455 |
| ncbi_104414885 | GIP2 | ncbi_104418598 | PLP2 | 317 |
| ncbi_104414885 | GIP2 | ncbi_104448269 | PLP2 | 317 |
| MSTRG.1672 | CALS7 | ncbi_104438610 | TOR | 299 |
| MSTRG.1672 | CALS7 | MSTRG.34,932 | MPT1 | 273 |
| MSTRG.1672 | CALS7 | MSTRG.26,157 | NTF4 | 613 |
| MSTRG.1672 | CALS7 | MSTRG.6764 | NTF4 | 613 |
| MSTRG.1672 | CALS7 | MSTRG.7876 | NTF4 | 613 |
| MSTRG.1672 | CALS7 | ncbi_104416115 | SEOB | 269 |
| MSTRG.1672 | CALS7 | ncbi_104428938 | SEOB | 269 |
| MSTRG.1672 | CALS7 | ncbi_104456128 | SEOB | 269 |
| MSTRG.1672 | CALS7 | ncbi_104414473 | UBQ8 | 267 |
| MSTRG.1672 | CALS7 | ncbi_104424210 | ACA9 | 558 |
| ncbi_104433548 | XTH33 | ncbi_104453907 | BGLU40 | 238 |
| ncbi_104433548 | XTH33 | ncbi_104426975 | HCT1 | 293 |
| ncbi_104433548 | XTH33 | ncbi_104429374 | CPK29 | 266 |
| ncbi_104433548 | XTH33 | ncbi_104448874 | CPK29 | 266 |
| ncbi_104433548 | XTH33 | ncbi_104447802 | CSLC12 | 281 |
| ncbi_104433548 | XTH33 | ncbi_104447973 | PHI-1 | 250 |
| ncbi_104433548 | XTH33 | ncbi_104447974 | PHI-1 | 250 |
| ncbi_104433548 | XTH33 | ncbi_104439106 | CESA1 | 354 |
| ncbi_104433548 | XTH33 | ncbi_104418686 | FUC95A | 560 |
| ncbi_104433548 | XTH33 | ncbi_104421950 | CESA3 | 272 |
| MSTRG.34,138 | ABCG32 | ncbi_104423226 | NRAMP6 | 294 |
| MSTRG.34,138 | ABCG32 | ncbi_104419893 | ABCG11 | 745 |
| MSTRG.34,138 | ABCG32 | ncbi_104419894 | ABCG11 | 745 |
| MSTRG.34,138 | ABCG32 | ncbi_104437526 | WAK1 | 339 |
| MSTRG.34,138 | ABCG32 | ncbi_104415306 | WRKY72A | 294 |
| MSTRG.34,138 | ABCG32 | ncbi_104451920 | LRK10L-2.8 | 275 |
| MSTRG.34,138 | ABCG32 | ncbi_104439706 | WAKL10 | 674 |
| MSTRG.34,138 | ABCG32 | ncbi_108955625 | SIRK | 393 |
| MSTRG.34,138 | ABCG32 | ncbi_104418598 | PLP2 | 241 |
| MSTRG.34,138 | ABCG32 | ncbi_104448269 | PLP2 | 241 |
| ncbi_104431697 | SBT1.8 | MSTRG.34,008 | AGO4 | 307 |
| ncbi_104431697 | SBT1.8 | MSTRG.35,704 | AGO4 | 307 |
| ncbi_104436406 | SBT1.8 | MSTRG.34,008 | AGO4 | 307 |
| ncbi_104436406 | SBT1.8 | MSTRG.35,704 | AGO4 | 307 |
| ncbi_104431697 | SBT1.8 | ncbi_104444321 | FLA8 | 319 |
| ncbi_104436406 | SBT1.8 | ncbi_104444321 | FLA8 | 319 |
| ncbi_104431697 | SBT1.8 | ncbi_104456685 | GEP | 273 |
| ncbi_104436406 | SBT1.8 | ncbi_104456685 | GEP | 273 |
| ncbi_104431697 | SBT1.8 | ncbi_104416751 | NPC6 | 244 |
| ncbi_104436406 | SBT1.8 | ncbi_104416751 | NPC6 | 244 |
| ncbi_104431697 | SBT1.8 | ncbi_104432400 | IRK | 483 |
| ncbi_104436406 | SBT1.8 | ncbi_104432400 | IRK | 483 |
| ncbi_104431697 | SBT1.8 | ncbi_104436031 | SCPL24 | 313 |
| ncbi_104436406 | SBT1.8 | ncbi_104436031 | SCPL24 | 313 |
| ncbi_104431697 | SBT1.8 | ncbi_104441483 | PME51 | 245 |
| ncbi_104436406 | SBT1.8 | ncbi_104441483 | PME51 | 245 |
| ncbi_104431697 | SBT1.8 | ncbi_104441672 | KAS1 | 295 |
| ncbi_104436406 | SBT1.8 | ncbi_104441672 | KAS1 | 295 |
| ncbi_104431697 | SBT1.8 | ncbi_104450842 | CESA6 | 400 |
| ncbi_104436406 | SBT1.8 | ncbi_104450842 | CESA6 | 400 |
| ncbi_104452223 | MOR1 | ncbi_104432381 | RECQL1 | 824 |
| ncbi_104452223 | MOR1 | ncbi_104432382 | RECQL1 | 824 |
| ncbi_104452223 | MOR1 | MSTRG.4427 | RECQL1 | 824 |
| ncbi_104452223 | MOR1 | MSTRG.4537 | RECQL1 | 824 |
| ncbi_104452223 | MOR1 | MSTRG.4556 | RECQL1 | 824 |
| ncbi_104452223 | MOR1 | MSTRG.10,654 | KIN14L | 762 |
| ncbi_104452223 | MOR1 | ncbi_104450402 | KIN14F | 789 |
| ncbi_104452223 | MOR1 | ncbi_104452745 | NDC80 | 976 |
| ncbi_104452223 | MOR1 | ncbi_104431802 | APC4 | 772 |
| ncbi_104452223 | MOR1 | MSTRG.14,678 | APC4 | 772 |
| ncbi_104431376 | RCA1 | ncbi_104437661 | EARLI1 | 299 |
| ncbi_104431376 | RCA1 | ncbi_104417708 | -- | 369 |
| ncbi_104431376 | RCA1 | ncbi_104430369 | -- | 369 |
| ncbi_104431376 | RCA1 | ncbi_104414473 | UBQ8 | 562 |
| ncbi_104431376 | RCA1 | ncbi_104425728 | -- | 245 |
| ncbi_104431376 | RCA1 | ncbi_104438038 | -- | 245 |
| ncbi_104431376 | RCA1 | ncbi_104438123 | -- | 245 |
| ncbi_104431376 | RCA1 | ncbi_104440141 | -- | 245 |
| ncbi_104431376 | RCA1 | ncbi_104438344 | HCF101 | 432 |
| ncbi_104431376 | RCA1 | MSTRG.1417 | CCB1 | 334 |
| ncbi_104444321 | FLA8 | ncbi_104416751 | NPC6 | 353 |
| ncbi_104444321 | FLA8 | ncbi_104447095 | nep1 | 276 |
| ncbi_104444321 | FLA8 | ncbi_104432400 | IRK | 585 |
| ncbi_104444321 | FLA8 | ncbi_104448229 | ATPC | 401 |
| ncbi_104444321 | FLA8 | ncbi_104448075 | DFC | 470 |
| ncbi_104444321 | FLA8 | ncbi_104441654 | GSVIVT00026920001 | 487 |
| ncbi_104444321 | FLA8 | ncbi_104436031 | SCPL24 | 281 |
| ncbi_104444321 | FLA8 | ncbi_104418686 | FUC95A | 288 |
| ncbi_104444321 | FLA8 | ncbi_104438577 | CSLA9 | 412 |
| ncbi_104444321 | FLA8 | ncbi_104420482 | PDCB2 | 312 |
| ncbi_104456905 | PAE12 | ncbi_104425451 | LRR-RLK | 407 |
| ncbi_104456905 | PAE12 | ncbi_104425462 | LRR-RLK | 407 |
| ncbi_104456905 | PAE12 | ncbi_104427508 | LRR-RLK | 407 |
| ncbi_104456905 | PAE12 | ncbi_104448590 | LRR-RLK | 407 |
| ncbi_104456905 | PAE12 | ncbi_104451578 | LRR-RLK | 407 |
| ncbi_104456905 | PAE12 | ncbi_108954066 | LRR-RLK | 407 |
| ncbi_104456905 | PAE12 | ncbi_104416283 | FH1 | 292 |
| ncbi_104456905 | PAE12 | ncbi_104425474 | -- | 825 |
| ncbi_104456905 | PAE12 | ncbi_104438301 | LRX3 | 694 |
| ncbi_104456905 | PAE12 | ncbi_104418686 | FUC95A | 469 |
| ncbi_104432337 | HIPP32 | MSTRG.33,358 | PAA1 | 961 |
| ncbi_104432337 | HIPP32 | MSTRG.33,637 | PAA1 | 961 |
| ncbi_104432337 | HIPP32 | ncbi_104420223 | AAO | 584 |
| ncbi_104432337 | HIPP32 | ncbi_104414198 | LAC9 | 584 |
| ncbi_104432337 | HIPP32 | ncbi_104445772 | LAC14 | 584 |
| ncbi_104432337 | HIPP32 | ncbi_104445774 | LAC14 | 584 |
| ncbi_104432337 | HIPP32 | ncbi_108960152 | LAC14 | 584 |
| ncbi_104432337 | HIPP32 | ncbi_104430680 | FKBP65 | 781 |
| ncbi_104432337 | HIPP32 | ncbi_104421331 | LAC17 | 584 |
| ncbi_104432337 | HIPP32 | ncbi_104418615 | Bp10 | 584 |
| ncbi_104454132 | HB2 | ncbi_104433804 | FAD12 | 329 |
| ncbi_104454132 | HB2 | ncbi_104447893 | CYP707A1 | 396 |
| ncbi_104454132 | HB2 | ncbi_104414279 | RALFL24 | 267 |
| ncbi_104454132 | HB2 | ncbi_104438296 | ALDH2C4 | 344 |
| ncbi_104454132 | HB2 | ncbi_104438297 | ALDH2C4 | 344 |
| ncbi_104454132 | HB2 | MSTRG.26,832 | SKL1 | 304 |
| ncbi_104454132 | HB2 | ncbi_104421945 | -- | 473 |
| ncbi_104454132 | HB2 | ncbi_104443017 | ACD6 | 337 |
| ncbi_104454132 | HB2 | MSTRG.25,454 | -- | 340 |
| ncbi_104454132 | HB2 | ncbi_104433835 | ALDH3F1 | 344 |
| ncbi_104447095 | nep1 | ncbi_104448075 | DFC | 239 |
| ncbi_104447095 | nep1 | ncbi_104431101 | CBP1 | 626 |
| ncbi_104447095 | nep1 | ncbi_104455131 | SCPL20 | 626 |
| ncbi_104447095 | nep1 | ncbi_104456944 | CBP1 | 626 |
| ncbi_104447095 | nep1 | ncbi_104457081 | CBP1 | 626 |
| ncbi_104447095 | nep1 | MSTRG.19,675 | CBP1 | 626 |
| ncbi_104447095 | nep1 | ncbi_104436031 | SCPL24 | 852 |
| ncbi_104447095 | nep1 | ncbi_104421950 | CESA3 | 309 |
| ncbi_104447095 | nep1 | ncbi_104453012 | SCPL18 | 626 |
| ncbi_104447095 | nep1 | ncbi_104453015 | SCPL18 | 626 |
| ncbi_104440695 | CALS12 | ncbi_104431100 | BETAB-AD | 333 |
| ncbi_104440743 | CALS12 | ncbi_104431100 | BETAB-AD | 333 |
| ncbi_104440695 | CALS12 | ncbi_104449176 | J | 611 |
| ncbi_104440743 | CALS12 | ncbi_104449176 | J | 611 |
| ncbi_104440695 | CALS12 | ncbi_104439106 | CESA1 | 306 |
| ncbi_104440743 | CALS12 | ncbi_104439106 | CESA1 | 306 |
| ncbi_104440695 | CALS12 | ncbi_104415634 | CBL10 | 346 |
| ncbi_104440695 | CALS12 | ncbi_104437838 | CBL10 | 346 |
| ncbi_104440743 | CALS12 | ncbi_104415634 | CBL10 | 346 |
| ncbi_104440743 | CALS12 | ncbi_104437838 | CBL10 | 346 |
| ncbi_104440695 | CALS12 | ncbi_104421950 | CESA3 | 380 |
| ncbi_104440743 | CALS12 | ncbi_104421950 | CESA3 | 380 |
| ncbi_104440695 | CALS12 | ncbi_104450192 | PSL4 | 568 |
| ncbi_104440743 | CALS12 | ncbi_104450192 | PSL4 | 568 |
| ncbi_104440695 | CALS12 | ncbi_104424371 | AGL42 | 611 |
| ncbi_104440695 | CALS12 | ncbi_104424376 | AGL42 | 611 |
| ncbi_104440695 | CALS12 | ncbi_104424377 | AGL42 | 611 |
| ncbi_104440743 | CALS12 | ncbi_104424371 | AGL42 | 611 |
| ncbi_104440743 | CALS12 | ncbi_104424376 | AGL42 | 611 |
| ncbi_104440743 | CALS12 | ncbi_104424377 | AGL42 | 611 |
The remaining target genes from other PPI networks can be found in Tables S10-14. Gene1_ID and Gene1_Symbol provide information about the central/hub proteins (genes) in the networks (Fig. 7), while Gene_2 ID and Gene_2 Symbol provide information about the peripheral proteins (genes) in the networks (Fig. 7). The combined_score value describes the reliability of the interaction between proteins (genes) that are connected in the PPI network according to the STRING database, with higher scores indicating more reliable relationships between two proteins
Discussion
The module that had both the highest Pearson’s correlation coefficient (as an absolute value) and lowest corresponding p-value may contain genes associated with growth in eucalypt [28]. This study also identified 5 DEGs through GO and GSEA-GO analysis that were upregulated in hybrids with superior growth traits, suggesting that they may be related to the regulation of heterosis for growth traits in eucalypt (Table 5). The up-regulation of ‘extracellular region’ genes has been implicated in grape development [29] and the enhancement of egg quality and reproduction in aquaculture [30]. The ‘external encapsulating structure’ primarily refers to the physical barrier surrounding cells or organisms, exemplified by cell walls. Currently, there is a paucity of specific reports linking this pathway to growth. However, we hypothesize that external encapsulating structures may modulate cell wall relaxation and facilitate cellular and organ growth by influencing cellulose, hemicellulose, and pectinase within plant cell walls. Furthermore, the cell periphery was associated with the cold tolerance of eucalypts [31]. Based on the identification of differentially expressed proteins localized within the ‘extracellular region’ KEGG pathway in this study, ‘extracellular region’ genes may regulate growth mechanisms by transmitting growth factor signals to cell periphery membrane receptors, activating the MAPK/CDPK pathway, facilitating protein or metabolite transport, and mitigating environmental stress during the reproductive phase.
Ribosomal subunits are the core machinery of protein synthesis, and their assembly, activity, and regulation directly affect cell proliferation, metabolic adaptation, and tissue development. The Cryphonectriaceae isolate identified from the ‘large ribosomal subunit’ of eucalypt was associated with pathogenicity in two eucalypt hybrids [32]. ‘Large subunit ribosomal’ DNA was commonly used for physiological activity research [33] and identification of fungi [34]. Although there is currently no research indicating a direct relationship between ‘ribosomal subunit’ and crop or forest growth, based on the proteins located in the KEGG pathway in this study, ‘large ribosomal subunit’ and ‘ribosomal subunit’ may be related to the translation and assembly of RPS2, LSM, SF3a, and elF3, and thus participate in the synthesis and genetic processes of eucalypt growth substances.
‘Extracellular region’, ‘external encapsulating structure’, ‘cell periphery’, ‘large ribosomal subunit’, and ‘ribosomal subunit’ were all enriched with cellular component terms (Fig. 2, Figure S8), pointing to the importance of cellular component terms for growth genetic mechanisms of heterosis. Blue light induced genes related to metabolic process and developmental process in the cellular component category, providing the molecular biological evidence for various light qualities on the growing process of B. rapa [35]. Cellular components were also related to the molecular mechanisms of chicken growth [36]. For example, a pollen-specific protein (Cla001608) that was enriched in this study provided insight into the molecular basis of the developmental stages of male flowers in watermelon and may aid in dominant cross breeding [37]. The dynamic coordination of cellular components and the efficiency of growth signaling pathways may be key to regulating growth.
Compared with the KEGG enrichment analysis results of this study, previous research on ‘plant-pathogen interaction’, biosynthesis of three amino acids, and ‘spliceosome’ related pathways have mostly been related to crop disease or stress resistance, with few studies showing they are related to growth traits. Studies have shown that ‘plant-pathogen interaction’ promotes the growth of rice [38] and tobacco [39], providing new insights and theoretical foundations for their breeding. ‘Plant-pathogen interaction’ was associated with the shedding of mature sugarcane leaves [40]. As the name suggests, ‘plant-pathogen interaction’ was more related to disease resistance and participates in abiotic stress tolerance [41], such as gummy stem blight (GSB) [42], and P. brassicae infection under dry climate conditions [43]. In addition, it affected salt resistance [44], drought resistance [45], detoxification pathways [46], and might also affect the mechanisms of flowering time control and adaptive evolution in plants growing at high altitudes [47]. ‘Phenylalanine, tyrosine and tryptophan biosynthesis’ might be related to the mechanisms of NC (Nitidine chloride) against hypoxic stress [48]. CircRNAs (non-coding RNAs) responded to abiotic stress in tomato by affecting splicesomes and other pathways, which might indicate that ‘spliceosome’ plays a biological role in multiple stress responses in plants [49]. Another study found some key pathways like ‘spliceosome’ (13 miRNAs) were involved in the mechanism underlying grapevine responses to heat and drought stress [50]. Based on the pathway enrichment results of our transcriptome data, it is believed that these three pathways may also be related to the heterosis of eucalypt growth, and certain gene expression products in these pathways played an indispensable role in it.
The products (i.e., proteins and metabolites) of genes that were in pathways associated with the heterosis of eucalypt growth and that were significantly up-regulated or down-regulated in genotypes exhibiting heterosis for growth are CDPK, CaMCML, EDS1, MPK3/6, and RPS2. These genes were specifically identified in the ‘Plant-pathogen interaction’ pathway as being associated with heterosis for growth. Previous studies have suggested that ‘Plant-pathogen interaction’ is related to growth and stress resistance. Calcium-dependent protein kinases (CDPKs), which are important sensors of Ca2 + flux in plants, are known to play essential roles in plant development and adaptation to abiotic stresses [51]. Studies have shown that PnCDPK1 is related to Japanese Morning Glory’s (Pharbitis nil)’s germination and seedling growth [52] as well as to changes in fruit yield and leaf dry matter production in tomatoes [53]. They concluded that PnCDPK52 is associated with the germination process and that PnCDPK56 is associated with seedling growth [54]. Likewise, PgCDPK1a was predicted to be a positive regulator of ginsing growth [55]. CaM-like protein CML is involved in plant growth, development, and stress adaptation [56]. EDS1 (Enhanced Disease Susceptibility 1) mainly plays a role in the innate immune response of plants and regulates seed yield [57]. Poplar EDS1 affected tree morphology, photosynthetic efficiency, ROS and SA metabolism, as well as leaf senescence [58]. MPK usually refers to Mitogen Activated Protein Kinase, which plays an important role in cell growth, differentiation, stress response and other cell signal transduction pathways. Studies have shown that light signal transcription factors FHY3 and FAR1 could integrate light signals with immune signals by directly interacting with EDS1 to widely regulate plant growth [59]. EDS1 might provide a novel resistance mechanism for the sustainable management of rust diseases [60]. According to a study by Brown et al. [61], MPK was associated with cold adaptation and frost resistance. The MAPK signaling pathway in plants maintained the adaptability of Populus simonii × Populus nigra to rapid growth by regulating the signal transduction of salt tolerant hormones [62]. Both this study and aforementioned research indicate that EDS1 has an important relationship with plant growth. RPS2 (ribosomal protein S2) belongs to the S5P family of ribosomal proteins and is a component of 40 S subunit. Modifications to RPS2 (LmjF.32.0450) possibly played important roles in L. tropica biology [63]. Another study showed that levels of 30 S RPS1 and RPS2 increased proportionately with the growth rate of resting maltose metabolizing cells, maltose-metabolizing cells, and glucose-metabolizing cells [64].
Compared to the ‘Plant-pathogen interaction’ pathway and its candidate gene products, there have been fewer studies on LSM, SF3a, and eIF3 in the ‘Splicosome’ pathway. LSM1-7 and LSM2-8 in Arabidopsis could actively regulate gene expression to fine-tune plant responses to abiotic stresses [65]. Together with the Yeast mediator protein, the LSM complex synergistically controlled growth by regulating the expression of ribosomal protein genes at the transcriptional and splicing levels [66]. In murine macrophages, SF3a had significant preference for mRNA splicing events within innate immune signaling pathways compared with other biological pathways, thereby affecting the splicing of specific genes in the TLR signaling pathway to modulate the innate immune response [67]. There was research showing that budding yeast eIF3 binding mRNA had a higher ribosome density in growing cells [68]. These conclusions all indicated that LSM, SF3a, and eIF3 were all related to RNA metabolism, possibly related to the sustained expression of growth response factors and the improvement of translation efficiency. However, there was currently almost no relevant research on the two candidate gene products in the ‘Phenylalanine, tyrosine and tryptophan biosynthesis’ pathway that we have identified. Therefore, our study reveals for the first time that TAT and ARO8 may be associated with the genetic mechanisms controlling heterosis of eucalypt growth.
Utilizing WGCNA, this study identified 19 gene co-expression modules significantly associated with growth traits. The tan module exhibited the most robust correlation with the target phenotype (Fig. 6). Compared to single-gene analysis, WGCNA elucidates synergistic regulatory patterns within gene modules, offering a systems-level perspective on the molecular mechanisms underlying complex traits. However, the connectivity of hub genes identified within the tan module via PPI network analysis was not strong. This may be attributed to the limited sample size, which could compromise module stability. Future studies should incorporate larger sample sizes to validate the generalizability of these hub genes. Furthermore, the extended breeding cycle of forest trees presents challenges in validating the regulatory effects on growth through functional experiments, such as hub gene knockout or overexpression. Nevertheless, we hypothesize that the upregulation of GOLS and K06617 proteins within the ‘Galactose metabolism’ pathway, mediated by seven hub genes, influences growth quality (Figure S19).
Reliance on a single analysis pipeline limited the robustness of findings. Consequently, future investigations may integrate single-cell metabolomics, multidimensional omics, and gene editing technologies to elucidate the correlation between key proteins and energy metabolism, thereby unraveling their profound impact on the heterosis of eucalypt growth. This approach aims to elucidate the regulatory mechanisms governing the spatiotemporally specific interaction networks of complex proteins, ultimately providing a programmable molecular blueprint for the precise design of high-yielding, stable hybrids.
Our previous results indicated that E. urophylla had the highest general combining ability (GCA) and special combining ability (SCA). E.tereticornis and E.urophylla all showed strong performance MPH (mid-parent heterosis) and HPH (high-parent heterosis) [9]. 8 common DEG pathways, including ‘Plant hormone signal transduction’ (KO04075) (Qvalue = 0.017821 < 0.05); ‘Cutin, suberine and wax biosynthesis’ (KO00073), ‘N-Glycan biosynthesis’ (KO00510), ‘Various types of N-glycan biosynthesis’ (KO00513), ‘Phenylpropanoid biosynthesis’ (KO00940), ‘Flavonoid biosynthesis’ (KO00941), ‘Ribosome biogenesis in eukaryotes’ (KO03008), and ‘Nucleocytoplasmic transport’ (KO03013) (FDR q-val < 0.25) were found in the four comparisons between the hybrids and their parents (H167 vs. T15, H167 vs. U3423, H74 vs. U3423, and H74 vs. U6) (Figure S8-11; Table 2, Table 3). In order to dispel doubts about whether different genotype combinations lead to differences in gene expression in hybrids, it is necessary to conduct transcriptome comparisons between two pairs of parents in the future. If these pathways are not found in the comparisons between parents, these 8 pathways are likely to serve as strong evidence of a positive correlation between combining ability and heterosis, explaining our previous conclusion from the perspective of growth genetic mechanisms of heterosis [9].
Prior to this, studies have shown that there was indeed heterosis between the two tree species in some aspects [69–72]. E. urophylla × E. grandis had stronger Al tolerance than its parents, which was indicative of heterosis [73]. Understanding how genetic recombination is directly related to heterosis means that genotype identification should be a primary objective for future studies [74]. Therefore, follow-up studies should combine haplotyping with transcriptomic sequencing results for the trait of interest.
Based on the current results of this study, we speculated that advantageous growth genes might indirectly regulate the growth mechanism of eucalypt through stress resistance under the pressure of natural selection, coupled with distinct AS patterns. SE was observed in the inheritance of inferior growth, whereas the converse was the case for RI. Dominant genes may mediate genetic stability and phenotypic plasticity by suppressing SNP mutations (preserving core function) while permitting regulated RI events (generating functional isoforms) (Figure S13; Figure S15). These findings suggest that AS may function as a buffering mechanism for adaptive evolution. During the genetic process, functional loss mutations resulting from exon skipping (SE) can induce growth disadvantages, whereas intron retention (RI) events may facilitate the accumulation of advantageous mutations. The findings from this study suggested that this ‘splicing-mediated mutation buffering’ could be attributed to the elevated RI/SE ratio during the genetic expression of growth-dominant genes (Figure S15). Mutations arising from SE events may initiate nonsense-mediated mRNA decay, leading to energy expenditure and growth impairment; conversely, RI may generate regulatory non-coding RNAs or functionally acquired isoforms by incorporating intronic regulatory elements, thereby promoting environmental adaptation. This energy-function trade-off, or key driving force, in shaping shear patterns within the environment, elucidates the macroscopic correlation between shear patterns and mutation adaptation. It must be noted that this study currently does not involve experimental or computer validation of hub genes (Table 6), so further validation through expression assays or functional annotations is needed to confirm their involvement in growth. It will also be necessary to validate the association between specific AS events and functional transcripts or pathways, while simultaneously assessing methylation or environmental effects to determine the credibility of the above hypotheses. More importantly, the significance of using the same materials to verify the genes identified in this study would not be sufficient to draw strong conclusions. For the genes screened in this study, genetic transformation methods are more meaningful, but the genetic transformation system of Chinese eucalypt has not yet been established. Therefore, functional validation of target genes, AS, and SNPs in model plants could be the follow-up to the study of genetic mechanisms of growth heterosis.
We have depicted the classification and quantity of JC differential AS using a bar chart (Figure S15A) and represented the classification and quantity of JCEC differential AS using a pie chart (Figure S15B). Surprisingly, the classification trend of JCEC differential AS aligns perfectly with that of JC differential AS. However, the number of differential AS detected using JCEC values exceeded that detected using JC values across all five comparisons. Notably, in H74 vs. U6, H74 vs. U3423, and H167 vs. H74, the differences in SE and RI counts were less pronounced when compared to those detected using JC values (Figure S15). Although in most studies, utilizing JCEC for differential AS statistics appears to yield fewer events with higher confidence and clearer biological significance, in our study of heterosis in eucalypt growth differences, we may lean towards using the JC method for differential AS classification and quantitative analysis. When solely exploring genes associated with growth traits, we might opt for JCEC to analyze the differential AS classification and quantity between two hybrids exhibiting significant growth differences. This approach would help narrow down the effect of AS events and facilitate verification or refined analysis. In addition, limited replication may reduce the statistical strength and reproducibility of transcriptome results, so increasing the number of biological replications, using more robust statistical modeling methods and using stricter result screening thresholds may break this limitation.
Conclusions
This study compared the differentially expressed genes of two opposing genotypes and their parents at the transcriptional level system. A highlight of this work is the creation of Python code capable of identifying common differential gene pathways and differential gene products. The use of this code ensured accuracy and efficiency while searching for candidate genes. Thus, the genetic mechanism of Heterosis in eucalypt growth were able to be studied in detail. A total of 6 pathways and 8 hub genes that may be related to eucalypt growth variation were identified. In addition, it was determined that SE events were possibly related to growth disadvantages, and RI events were possibly related to growth advantages.
Our research findings contribute to accelerating research on the genetic mechanisms of heterosis and the elucidation of the genetic mechanisms of heterosis by combining phenotypic analysis, differential gene expression analysis, WGCNA, alternative splicing abundance analysis, and GO enrichment analysis.
Supplementary Information
Acknowledgements
We are grateful to the fund the National Key Research and Development Program of China, grant number 2022YFD2200203--3.
Abbreviations
- GO
Gene ontology
- KEGG
Kyoto encyclopedia of genes and genomes
- GSEA
Gene set enrichment analysis
- WGCNA
Weighted gene co-expression network analysis
- AS
Alternative splicing
- SE
Skipped exon
- RI
Retained intron
- HT
Height
- DBH
Diameter at breast height
- VOL
Relative volume
- SUR
Survival rate
- SS
Stem straightness
- FPKM
Fragment per kilobase of transcript per million mapped reads
- RSEM
RNA-seq by expectation-maximization
- PCA
Principal component analysis
- FDR
False discovery rate
- DEG
Differentially expressed gene
- SNP
Single nucleotide polymorphism
- PPI
Protein protein interaction
- Kin
Intramodular connectivity
- MM
Module correlation degree
- GS
Gene significance
- JC
The number of exon skipping isoform reads from target and junction counts per genotype
- JCEC
The number of exon inclusion isoform reads from target and junction counts per genotype
- MPH
Mid-parent heterosis
- HPH
High-parent heterosis
Authors’ contributions
LJZ is responsible for experimental design and afforestation; LY and LWH are responsible for controlling pollination and afforestation; LG and HAY are responsible for afforestation; SZY and LWH are responsible for data collection and investigation; SZY is responsible for data organization and analysis; SZY and LWH are responsible for writing manuscript.
Funding
the National Key Research and Development Program of China, grant number 2022YFD2200203–3.
Data availability
Data is provided within the manuscript or supplementary information files. The first author (zhiyisu_caf_ac_cn@163.com) has to be contacted in case of any queries or requirement of data. Including BioProject (1): https://www.ncbi.nlm.nih.gov/bioproject/?term=PRJNA1306522, SRA (15): SRR35135247 (H74-1): https://www.ncbi.nlm.nih.gov/sra/?term=SRR35135247, SRR35135246(H74-2): https://www.ncbi.nlm.nih.gov/sra/?term=SRR35135246, SRR35135240 (H74-3): https://www.ncbi.nlm.nih.gov/sra/?term=SRR35135240, SRR35135239 (H167-1): https://www.ncbi.nlm.nih.gov/sra/?term=SRR35135239, SRR35135238 (H167-2): https://www.ncbi.nlm.nih.gov/sra/?term=SRR35135238, SRR35135237 (H167-3): https://www.ncbi.nlm.nih.gov/sra/?term=SRR35135237, SRR35135243 (U3423-1): https://www.ncbi.nlm.nih.gov/sra/?term=SRR35135243, SRR35135242 (U3423-2): https://www.ncbi.nlm.nih.gov/sra/?term=SRR35135242, SRR35135241 (U3423-3): https://www.ncbi.nlm.nih.gov/sra/?term=SRR35135241, SRR35135236 (T15-1): https://www.ncbi.nlm.nih.gov/sra/?term=SRR35135236, SRR35135235 (T15-2): https://www.ncbi.nlm.nih.gov/sra/?term=SRR35135235, SRR35135234 (T15-3): https://www.ncbi.nlm.nih.gov/sra/?term=SRR35135234, SRR35135233 (U6-1): https://www.ncbi.nlm.nih.gov/sra/?term=SRR35135233, SRR35135245 (U6-2): https://www.ncbi.nlm.nih.gov/sra/?term=SRR35135245, SRR35135244 (U6-3): https://www.ncbi.nlm.nih.gov/sra/?term=SRR35135244.
Declarations
Ethics approval and consent to participate
Not applicable.
Consent for publication
Not applicable.
Competing interests
The authors declare no competing interests.
Footnotes
Publisher’s Note
Springer Nature remains neutral with regard to jurisdictional claims in published maps and institutional affiliations.
References
- 1.Zhou XD, Wingfield MJ. Eucalypt diseases and their management in China. Australas Plant Pathol. 2011;40(4):339–45. 10.1007/s13313-011-0053-y. [Google Scholar]
- 2.Ouyang LN, Chen SX, Yang WT, Zheng JQ, Ye LS, Liu Q, et al. Organic fertilizer improved the lead and cadmium metal tolerance of Eucalyptus camaldulensis by enhancing the uptake of potassium, phosphorus, and calcium. Front Plant Sci. 2024;15:1444227. 10.3389/fpls.2024.1444227. [DOI] [PMC free article] [PubMed] [Google Scholar]
- 3.Su ZY, Lu WH, Lin Y, Luo JZ, Liu G, Huang AY. Exploring the genetic basis of Calonectria spp. Resist Eucalypts CIMB. 2024;46:10854–79. 10.3390/cimb46100645. [DOI] [PMC free article] [PubMed] [Google Scholar]
- 4.Liu G, Wu ZH, Luo JZ, Wang CB, Shang XH, Zhang GW. Genes expression profiles in vascular cambium of Eucalyptus urophylla x Eucalyptus grandis at different ages. BMC Plant Biol. 2023;23(1):500. 10.1186/s12870-023-04500-8. [DOI] [PMC free article] [PubMed] [Google Scholar]
- 5.Grattapaglia D, Silva-Junior OB, Resende RT. Quantitative genetics and genomics converge to accelerate forest tree breeding. Front Plant Sci. 2018;9:1693. 10.3389/fpls.2018.01693. [DOI] [PMC free article] [PubMed] [Google Scholar]
- 6.Miao LF, Chen Z, Gao LF, Jia JZ, Guo WL, Zhao GY. Integrated multi-omics reveals contrasting epigenetic patterns in leaf and root morphogenesis in Aegilops Speltoides. Crop J. 2025;13(1):292–8. 10.1016/j.cj.2024.09.015. [Google Scholar]
- 7.Jaligot E, Rival A. Applying epigenetics in plant breeding: balancing genome stability and phenotypic plasticity. In: Al-Khayri J, Jain S, Johnson D, editors. Advances in plant breeding strategies: breeding, biotechnology and molecular tools. Cham: Springer; 2015. 10.1007/978-3-319-22521-0_6. [Google Scholar]
- 8.Zhu S, Xu M, Wang HR, Pan HX, Wang GP, Huang MR. Study of spontaneous mutations in the transmission of poplar chloroplast genomes from mother to offspring. BMC Genomics. 2018; 19: 411. https://doi.10.1186/s12864-018-4813-8. [DOI] [PMC free article] [PubMed]
- 9.Su ZY, Lu WH, Cao HY, Liu G, Lin Y, Huang AY, et al. Analysis of combining ability and heterosis based on controlled pollination populations of eucalypt. Sci Rep. 2025;15(1):11255. 10.1038/s41598-025-94204-w. [DOI] [PMC free article] [PubMed] [Google Scholar]
- 10.Chen SF, Zhou YQ, Chen YR, Gu J. Fastp: an ultra-fast all-in-one FASTQ preprocessor[J]. Bioinformatics. 2018;34(17):884–90. 10.1093/bioinformatics/bty560. [DOI] [PMC free article] [PubMed] [Google Scholar]
- 11.Langmead B, Salzberg SL. Fast gapped-read alignment with bowtie 2. Nat Methods. 2012;9(4):357–9. 10.1038/NMETH.1923. [DOI] [PMC free article] [PubMed] [Google Scholar]
- 12.Kim D, Langmead B, Salzberg SL. HISAT: a fast spliced aligner with low memory requirements. Nat Methods. 2015;12(4):357. 10.1038/NMETH.3317. [DOI] [PMC free article] [PubMed] [Google Scholar]
- 13.Pertea M, Pertea GM, Antonescu CM, Chang TC, Mendell JT, Salzberg SL. Stringtie enables improved reconstruction of a transcriptome from RNA-seq reads. Nat Biotechnol. 2015;33(3):290. 10.1038/nbt.3122. [DOI] [PMC free article] [PubMed] [Google Scholar]
- 14.Pertea M, Kim D, Pertea GM, Leek JT, Salzberg SL. Transcript-level expression analysis of RNA-seq experiments with HISAT, stringtie and ballgown. Nat Protoc. 2016;11(9):1650–67. 10.1038/nprot.2016.095. [DOI] [PMC free article] [PubMed] [Google Scholar]
- 15.Shannon P, Markiel A, Ozier O, et al. Cytoscape: a software environment for integrated models of biomolecular interaction networks. Genome Res. 2003;13(11):2498–504. 10.1101/gr.1239303. [DOI] [PMC free article] [PubMed] [Google Scholar]
- 16.Li B, Dewey CN. RSEM: accurate transcript quantification from RNA-seq data with or without a reference genome. BMC Bioinformatics. 2011;12:323. 10.1186/1471-2105-12-323. [DOI] [PMC free article] [PubMed] [Google Scholar]
- 17.Warnes GR, Bolker B, Lumley T et al. gmodels: Various R programming tools for model fitting: https://CRAN.R-project.org/package=gmodels. URL: https://github.com/r-gregmisc/gmodels. Published: 2024-03-06. Version: 2.19.1. 10.32614/CRAN.package.gmodels
- 18.Love MI, Huber W, Anders S. Moderated estimation of fold change and dispersion for RNAseq data with DESeq2. Genome Biol. 2014;15(12):550. 10.1186/s13059-014-0550-8. [DOI] [PMC free article] [PubMed] [Google Scholar]
- 19.Robinson MD, McCarthy DJ, Smyth GK. Bioinformatics. 2010;26(1):139–40. 10.1093/bioinformatics/btp616. edgeR: a Bioconductor package for differential expression analysis of digital gene expression data[J]. [DOI] [PMC free article] [PubMed]
- 20.Ashburner M, Ball CA, Blake JA, et al. Gene ontology: tool for the unification of biology. Nat Genet. 2000;25(1):25–9. 10.1038/75556. [DOI] [PMC free article] [PubMed] [Google Scholar]
- 21.Kanehisa M, Goto S. KEGG: Kyoto encyclopedia of genes and genomes[J]. Nucleic Acids Res. 2000;28(1):27–30. 10.1093/nar/28.1.27. [DOI] [PMC free article] [PubMed] [Google Scholar]
- 22.Subramanian A, Tamayo P, Mootha VK, et al. Gene set enrichment analysis: a knowledge based approach for interpreting genome-wide expression profiles. Proc Natl Acad Sci U S A. 2005;102(43):15545–50. 10.1073/pnas.0506580102. [DOI] [PMC free article] [PubMed] [Google Scholar]
- 23.Pightling AW, Petronella N, Pagotto F. Choice of reference sequence and assembler for alignment of Listeria monocytogenes short-read sequence data greatly influences rates of error in SNP analyses. PLoS One. 2014;9(8):e104579. 10.1371/journal.pone.0104579. [DOI] [PMC free article] [PubMed] [Google Scholar]
- 24.Ramaswami G, Zhang R, Piskol R, Keegan LP, Deng P, O’Connell MA, Li JB. Identifying RNA editing sites using RNA sequencing data alone. Nat Methods. 2013;10(2):128–32. 10.1038/NMETH.2330. [DOI] [PMC free article] [PubMed] [Google Scholar]
- 25.Bahn JH, Lee JH, Li G, Greer C, Peng GD, Xiao XS. Accurate identification of A-to-I RNA editing in human by transcriptome sequencing. Genome Res. 2012;22(1):142–50. 10.1101/gr.124107.111. [DOI] [PMC free article] [PubMed] [Google Scholar]
- 26.Shen SH, Park JW, Lu ZX, et al. PNAS. 2014;111(51):E5593–601. 10.1073/pnas.1419161111. rMATS: Robust and flexible detection of differential alternative splicing from replicate RNA-Seq data[J]. [DOI] [PMC free article] [PubMed]
- 27.Szklarczyk D, Franceschini A, Wyder S, et al. STRING v10: protein–protein interaction networks, integrated over the tree of life[J]. Nucleic Acids Res. 2014;43(D1):D447–52. 10.1093/nar/gku1003. [DOI] [PMC free article] [PubMed] [Google Scholar]
- 28.Langfelder P, Horvath S. WGCNA: an R package for weighted correlation network analysis. BMC Bioinformatics. 2008;9:559. 10.1186/1471-2105-9-559. [DOI] [PMC free article] [PubMed] [Google Scholar]
- 29.Shiri Y, Solouki M, Ebrahimie E, Emamjomeh A, Zahiri J. Unraveling the transcriptional complexity of compactness in Sistan grape cluster. Plant Sci. 2018;270:198–208. 10.1016/j.plantsci.2018.02.011. [DOI] [PubMed] [Google Scholar]
- 30.Gao XM, Lv YP, Dai QM, et al. Histological and transcriptomic insights into the ovary development of Hemibarbus labeo injected with Spawn-Inducing hormones. Mar Biotechnol. 2024;26(4):672–86. 10.1007/s10126-024-10335-7. [DOI] [PubMed] [Google Scholar]
- 31.Gaete-Loyola J, Lagos C, Beltrán MF, Valenzuela S, Emhart V, Fernández M. Transcriptome profiling of Eucalyptus nitens reveals deeper insight into the molecular mechanism of cold acclimation and deacclimation process. Tree Genet Genomes. 2017;13(2):37. 10.1007/s11295-017-1121-4. [Google Scholar]
- 32.Wang W, Li GQ, Liu QL, Chen SF. Cryphonectriaceae on myrtales in china: phylogeny, host range, and pathogenicity. Persoonia. 2020;45:101–3. 10.3767/persoonia.2020.45.04. [DOI] [PMC free article] [PubMed] [Google Scholar]
- 33.Kobae Y, Ohtomo R, Oka N, Morimoto S. A simple model system for identifying arbuscular mycorrhizal taxa that actively colonize rice (Oryza sativa L.) roots grown in field. J Soil Sci Plant Nutr. 2017;63(1):29–36. 10.1080/00380768.2016.1277156. [Google Scholar]
- 34.Lee SH, Nguyen TTT, Lee HB. Isolation and characterization of two rare Mucoralean species with specific habitats. Mycobiology. 2018;46(3):205–14. 10.1080/12298093.2018.1509513. [DOI] [PMC free article] [PubMed] [Google Scholar]
- 35.Kim JA, Lee YH, Hong JK, et al. Effects of light quality using LEDs on expression patterns in Brassica rapa seedlings. Korean J Hortic Sci Technol. 2013;31(5):607–16. 10.7235/hort.2013.12184. [Google Scholar]
- 36.He ML, Wu PF, Chen FX. Transcriptome analysis of leg muscles in fast and slow growth Bian chickens. Anim Biotechnol. 2020;31(4):295–305. 10.1080/10495398.2019.1588129. [DOI] [PubMed] [Google Scholar]
- 37.Zhu YC, Yuan GP, Jia SF, An GL, Li WH, Sun DX, Liu JP. Transcriptomic profiling of watermelon (Citrullus lanatus) provides insights into male flowers development. J Integr Agric. 2022;21(2):407–21. 10.1016/S2095-3119(21)63615-8. [Google Scholar]
- 38.Zhou JP, Zhang R, Jia XY. CRISPR-Cas9 mediated OsMIR168a knockout reveals its pleiotropy in rice. Plant Biotechnol J. 2022;20(2):310–22. 10.1111/pbi.13713. [DOI] [PMC free article] [PubMed] [Google Scholar]
- 39.Jiang JR, Huang HT, Gao Q, et al. Effects of editing DFR genes on flowers, leaves, and roots of tobacco. BMC Plant Biol. 2023;23(1):349. 10.1186/s12870-023-04307-7. [DOI] [PMC free article] [PubMed] [Google Scholar]
- 40.Li M, Liang ZX, Zeng Y, et al. De novo analysis of transcriptome reveals genes associated with leaf abscission in sugarcane (Saccharum officinarum L). BMC Genomics. 2016;17:195. 10.1186/s12864-016-2552-2. [DOI] [PMC free article] [PubMed] [Google Scholar]
- 41.Baeshen MN, Ahmed F, Moussa TAA, et al. A comparative analysis of de novo transcriptome assembly to understand the abiotic stress adaptation of desert plants in Saudi Arabia. Appl Ecol Environ Res. 2021;19(3):1753–82. 10.15666/aeer/1903_17531782. [Google Scholar]
- 42.Zhang R, Chen J, Zhang YB, et al. Long noncoding RNA–messenger RNA (lncRNA–mRNA) network in resistance to gummy stem blight (Stagonosporopsis cucurbitacearum) of melon plant introduction (PI) 420145. Horticulturae. 2025;11(1):31. 10.3390/horticulturae11010031. [Google Scholar]
- 43.Zhu HF, Li XF, Xi DD, Zhai W, Zhang ZH, Zhu YY. Integrating long noncoding RNAs and mRNAs expression profiles of response to Plasmodiophora brassicae infection in Pakchoi (Brassica campestris ssp. chinensis Makino). PLoS ONE. 2019;14(12):e0224927. 10.1371/journal.pone.0224927. [DOI] [PMC free article] [PubMed] [Google Scholar]
- 44.Yang S, Liu MS, Chu N, et al. Combined transcriptome and metabolome reveal glutathione metabolism plays a critical role in resistance to salinity in rice landraces HD961. Front Plant Sci. 2022;13:952595. 10.3389/fpls.2022.952595. [DOI] [PMC free article] [PubMed] [Google Scholar]
- 45.Wan LQ, Li Y, Li S, Li XL. Transcriptomic profiling revealed genes involved in response to drought stress in alfalfa. J Plant Growth Regul. 2022;41(1):92–112. 10.1007/s00344-020-10287-x. [Google Scholar]
- 46.Tang JZ, Ding YX, Nan J, Yang XY, Sun L, Zhao XY, et al. Transcriptome sequencing and ITRAQ reveal the detoxification mechanism of Bacillus GJ1, a potential biocontrol agent for Huanglongbing. PLoS ONE. 2018;13(8):e0200427. 10.1371/journal.pone.0200427. [DOI] [PMC free article] [PubMed] [Google Scholar]
- 47.Li Y, Zhang CX, Yang KB, Shi JJ, Ding YL, Gao ZM. De novo sequencing of the transcriptome reveals regulators of the floral transition in Fargesia macclureana (Poaceae). BMC Genomics. 2019;20(1):1035. 10.1186/s12864-019-6418-2. [DOI] [PMC free article] [PubMed] [Google Scholar]
- 48.Kong ZW, Pan HC, Wang Z, Abla A, Wei YM. Nitidine chloride alleviates hypoxic stress via PINK1-Parkin-mediated mitophagy in the mammary epithelial cells of milk Buffalo. Animals. 2024;14(20):3016. 10.3390/ani14203016. [DOI] [PMC free article] [PubMed] [Google Scholar]
- 49.Zhou R, Yu XQ, Ottosen CO, Zhao TM. High throughput sequencing of circrnas in tomato leaves responding to multiple stresses of drought and heat. Hortic Plant J. 2020;6(1):34–8. 10.1016/j.hpj.2019.12.004. [Google Scholar]
- 50.Ju YL, Min Z, Zhang Y, Zhang KK, Liu M, Fang YL. Transcriptome profiling provide new insights into the molecular mechanism of grapevine response to heat, drought, and combined stress. Sci Hortic. 2021;286:110076. 10.1016/j.scienta.2021.110076. [Google Scholar]
- 51.Dubrovina AS, Kiselev KV, Khristenko VS. Expression of calcium-dependent protein kinase (CDPK) genes under abiotic stress conditions in wild-growing grapevine Vitis amurensis. J Plant Physiol. 2013;170(17):1491–500. 10.1016/j.jplph.2013.06.014. [DOI] [PubMed] [Google Scholar]
- 52.Jaworski K, Pawelek A, Szmidt-Jaworska A, Kopcewicz J. Expression of Calcium-Dependent protein kinase gene (PnCDPK1) is affected by various light conditions in pharbitis nil seedlings. J Plant Growth Regul. 2010;29(3):316–27. 10.1007/s00344-010-9138-z. [Google Scholar]
- 53.Bertoldo G, Lucia MCD, Baghdadi A, et al. Molecular and ionomic responses of solanum lycopersicum L. (cv. Micro-Tom) plants treated with a novel calcium-based plant biostimulant. Plant Gene. 2023;34:100408. 10.1016/j.plgene.2023.100408. [Google Scholar]
- 54.Jaworski K, Szmidt-Jaworska A, Kopcewicz J. Two calcium dependent protein kinases are differently regulated by light and have different activity patterns during seedling growth in Pharbitis nil. Plant Growth Regul. 2011;65(2):369–79. 10.1007/s10725-011-9609-7. [Google Scholar]
- 55.Kiselev KV, Turlenko AV, Zhuravlev YN. Structure and expression profiling of a novel calcium-dependent protein kinase gene PgCDPK1a in roots, leaves, and cell cultures of Panax ginseng. Plant Cell Tiss Org. 2010;103(2):197–204. 10.1007/s11240-010-9767-8. [Google Scholar]
- 56.Dubrovina AS, Aleynova OA, Ogneva ZV, Suprun AR, Ananev AA, Kiselev KV. The effect of abiotic stress conditions on expression of calmodulin (CaM) and calmodulin-like (CML) genes in wild-growing grapevine Vitis amurensis. Plants. 2019;8(12):602. 10.3390/plants8120602. [DOI] [PMC free article] [PubMed] [Google Scholar]
- 57.Wituszynska W, Slesak I, Vanderauwera S, et al. LESION SIMULATING DISEASE1, ENHANCED DISEASE SUSCEPTIBILITY1, and PHYTOALEXIN DEFICIENT4 conditionally regulate cellular signaling homeostasis, photosynthesis, water use efficiency, and seed yield in Arabidopsis. Plant Physiol. 2013;161(4):1795–805. 10.1104/pp.112.208116. [DOI] [PMC free article] [PubMed] [Google Scholar]
- 58.Bernacki MJ, Czarnocka W, Witon D, et al. ENHANCED DISEASE SUSCEPTIBILITY 1 (EDS1) affects development, photosynthesis, and hormonal homeostasis in hybrid Aspen (Populus tremula L. x P. tremuloides). J Plant Physiol. 2018;226:91–102. 10.1016/j.jplph.2018.04.014. [DOI] [PubMed] [Google Scholar]
- 59.Wang WQ, Zhao GQ, Wu S, Hua W, Zhang T, Ruan ROE, et al. Revealing the core transcriptome modulating plant growth phase in Arabidopsis thaliana by RNA sequencing and coexpression analysis of the fhy3 far1 mutant. Acta Soc Bot Pol. 2020;89(2):8924. 10.5586/asbp.8924. [Google Scholar]
- 60.Sahu R, Prabhakaran N, Kundu P, Kumar A. Differential response of phytohormone signalling network determines nonhost resistance in rice during wheat stem rust (Puccinia Graminis f. Sp. tritici) colonization. Plant Pathol. 2021;70(6):1409–20. 10.1111/ppa.13376. [Google Scholar]
- 61.Brown JM, Weldt CE, Holloway HMP, et al. Transcriptomic analysis of Zoysia japonica provides novel insights into the molecular basis of cold acclimation. Grass Research. 2023;3:25. 10.48130/GR-2023-0025. [Google Scholar]
- 62.Song JQ, Wang JC, Qin R, et al. RNA-Seq-based WGCNA reveals the physiological and molecular responses of Poplar leaves to NaHCO3 stress. Trees - Struct Function. 2025;39(1):3. 10.1007/s00468-024-02577-8. [Google Scholar]
- 63.Ashrafmansouri M, Amiri-Dashatan N, Ahmadi N. Identification of protein profile in metacyclic and amastigote-like stages of Leishmania tropica: a proteomic approach. Amb Express. 2022;12(1):142. 10.1186/s13568-022-01481-z. [DOI] [PMC free article] [PubMed] [Google Scholar]
- 64.Palmfeldt J, Levander F, Hahn-Hägerdal B, James P. Acidic proteome of growing and resting Lactococcus lactis metabolizing maltose. Proteomics. 2004;4(12):3881–98. 10.1002/pmic.200400858. [DOI] [PubMed] [Google Scholar]
- 65.Catalá R, Carrasco-López C, Perea-Resa C, Hernández-Verdeja T, Salinas J. Emerging roles of LSM complexes in posttranscriptional regulation of plant response to abiotic stress. Front Plant Sci. 2019;10:167. 10.3389/fpls.2019.00167. [DOI] [PMC free article] [PubMed] [Google Scholar]
- 66.Abdel-Fattah WR, Carlsson M, Hu GZ, et al. Growth-regulated co-occupancy of mediator and Lsm3 at intronic ribosomal protein genes. Nucleic Acids Res. 2024;52(11):6220–33. 10.1093/nar/gkae266. [DOI] [PMC free article] [PubMed] [Google Scholar]
- 67.O’Connor BP, Danhorn T, De Arras L, et al. Regulation of toll-like receptor signaling by the SF3a mRNA splicing complex. PLoS Genet. 2015;11(2):e1004932. 10.1371/journal.pgen.1004932. [DOI] [PMC free article] [PubMed] [Google Scholar]
- 68.Koubek J, Kaur J, Bhandarkar S. Cellular translational enhancer elements that recruit eukaryotic initiation factor 3. RNA. 2025;31(2):193–207. 10.1261/rna.080310.124. [DOI] [PMC free article] [PubMed] [Google Scholar]
- 69.Weng Q, He X, Li F, Li M, Yu X, Shi J, et al. Hybridizing ability and heterosis between Eucalyptus urophylla and E-tereticornis for growth and wood density over two environments. Silvae Genet. 2014;63(1–2):15–24. 10.1515/sg-2014-0003. [Google Scholar]
- 70.dos Santos GA, Nunes ACP, de Resende MDV, Silva LD, Higa A, de Assis TF. An index combining volume and Pilodyn penetration to study stability and adaptability of Eucalyptus multi-species hybrids in Rio Grande do sul, Brazil. AUSTRALIAN FORESTRY. 2016;79(4):248–55. 10.1080/00049158.2016.1237253. [Google Scholar]
- 71.Chen SK, Weng QJ, Li FG, Li M, Zhou CP, Gan SM. Genetic parameters for growth and wood chemical properties in Eucalyptus urophylla × E. tereticornis hybrids. Ann For Sci. 2018;75(1):16. 10.1007/s13595-018-0694-x. [Google Scholar]
- 72.Chen SK, Zhou CP, He XD, et al. Enhanced correlations of EST-SSR-based genetic distance with hybrid performance, specific hybridizing ability, and heterosis using effect-increasing and effect-decreasing alleles: a case study in Eucalyptus l’her. Tree Genet Genomes. 2020;16(1):16. 10.1007/s11295-019-1410-1. [Google Scholar]
- 73.Ouyang ZL, Liu B, Li TK, Bai TD, Teng WC. Effects of aluminum on metabolism of reactive oxygen species and reactive nitrogen species in root tips of different Eucalyptus species. BMC Plant Biol. 2025;25(1):55. 10.1186/s12870-024-06042-z. [DOI] [PMC free article] [PubMed] [Google Scholar]
- 74.Lu WH, Arnold RJ, Wang CB, Lin Y, Luo JZ, Meder R, et al. Defining Eucalyptus urophylla with its hybrid and the rules of genetic recombination using near infrared spectroscopy. J Near Infrared Spectrosc. 2021;29(4):236–44. 10.1177/09670335211008257. [Google Scholar]
Associated Data
This section collects any data citations, data availability statements, or supplementary materials included in this article.
Data Citations
- Robinson MD, McCarthy DJ, Smyth GK. Bioinformatics. 2010;26(1):139–40. 10.1093/bioinformatics/btp616. edgeR: a Bioconductor package for differential expression analysis of digital gene expression data[J]. [DOI] [PMC free article] [PubMed]
- Shen SH, Park JW, Lu ZX, et al. PNAS. 2014;111(51):E5593–601. 10.1073/pnas.1419161111. rMATS: Robust and flexible detection of differential alternative splicing from replicate RNA-Seq data[J]. [DOI] [PMC free article] [PubMed]
Supplementary Materials
Data Availability Statement
Data is provided within the manuscript or supplementary information files. The first author (zhiyisu_caf_ac_cn@163.com) has to be contacted in case of any queries or requirement of data. Including BioProject (1): https://www.ncbi.nlm.nih.gov/bioproject/?term=PRJNA1306522, SRA (15): SRR35135247 (H74-1): https://www.ncbi.nlm.nih.gov/sra/?term=SRR35135247, SRR35135246(H74-2): https://www.ncbi.nlm.nih.gov/sra/?term=SRR35135246, SRR35135240 (H74-3): https://www.ncbi.nlm.nih.gov/sra/?term=SRR35135240, SRR35135239 (H167-1): https://www.ncbi.nlm.nih.gov/sra/?term=SRR35135239, SRR35135238 (H167-2): https://www.ncbi.nlm.nih.gov/sra/?term=SRR35135238, SRR35135237 (H167-3): https://www.ncbi.nlm.nih.gov/sra/?term=SRR35135237, SRR35135243 (U3423-1): https://www.ncbi.nlm.nih.gov/sra/?term=SRR35135243, SRR35135242 (U3423-2): https://www.ncbi.nlm.nih.gov/sra/?term=SRR35135242, SRR35135241 (U3423-3): https://www.ncbi.nlm.nih.gov/sra/?term=SRR35135241, SRR35135236 (T15-1): https://www.ncbi.nlm.nih.gov/sra/?term=SRR35135236, SRR35135235 (T15-2): https://www.ncbi.nlm.nih.gov/sra/?term=SRR35135235, SRR35135234 (T15-3): https://www.ncbi.nlm.nih.gov/sra/?term=SRR35135234, SRR35135233 (U6-1): https://www.ncbi.nlm.nih.gov/sra/?term=SRR35135233, SRR35135245 (U6-2): https://www.ncbi.nlm.nih.gov/sra/?term=SRR35135245, SRR35135244 (U6-3): https://www.ncbi.nlm.nih.gov/sra/?term=SRR35135244.