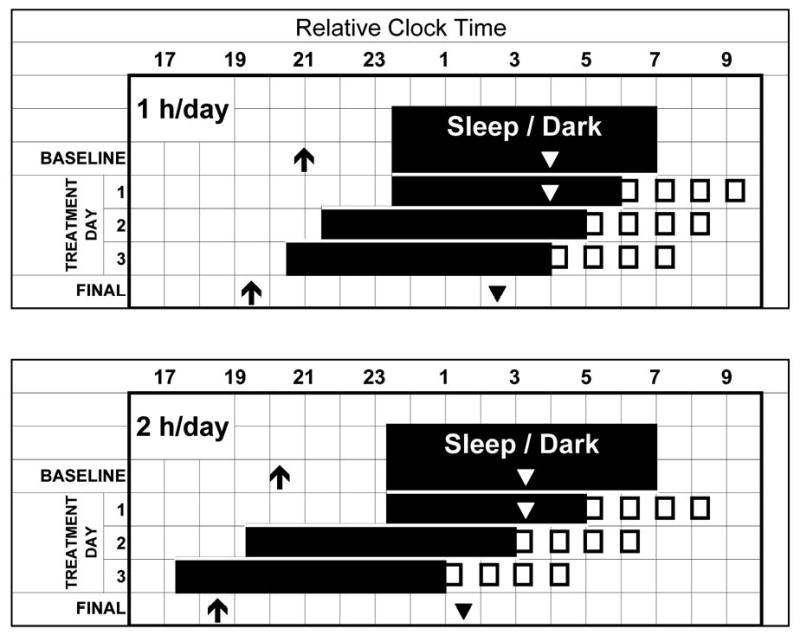
Figure 1.

Protocol for 1-hour-per-day (top) and 2-hours-per-day (bottom) groups. All elements are normalized to a 7:00 am wake time. Arrows represent the time of the average dim light melatonin onsets (DLMO) determined from the baseline and final phase assessments. Triangles represent the estimated times of the temperature minima (7 hours after the DLMO). The first 2 rows represent the average sleep/dark times during baseline. There was no sleep/dark episode during the phase assessments; the arrow and triangle from the baseline phase assessment (which was conducted a few days earlier) are drawn on the last baseline day to illustrate the phase relationships between these circadian phase markers and sleep. Open boxes represent the time of the 0.5-hour bright-light pulses each morning.
