
Figure 2.
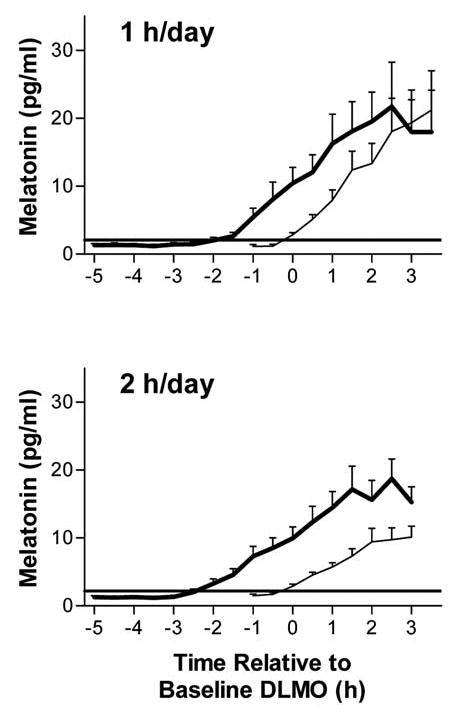
Melatonin profiles for the 1-hour-per-day (n = 11) and 2-hours-per-day (n = 15) groups. Error bars represent SEM. In each graph, the lighter line shows the mean profile during the baseline phase assessment, and the bold line shows the profile during the final phase assessment. Horizontal lines indicate the average dim light melatonin onset (DLMO) threshold for each group. The mean melatonin profiles were constructed referencing each subject’s data to the time of his or her DLMO from the baseline phase assessment.