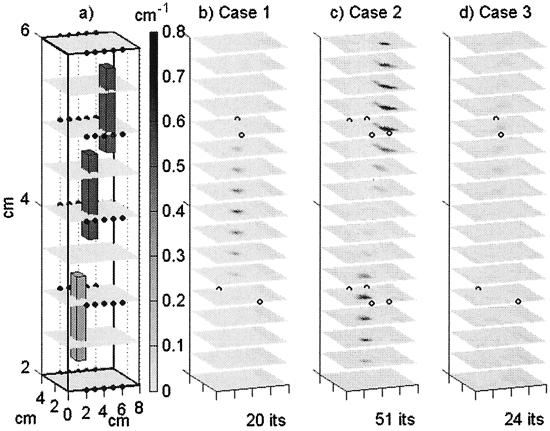
Figure 1.
(a) The initial homogeneous estimate discretized onto the 9 × 17 × 17 grid used for the initial inversion iteration, and shown with the true locations of the three heterogeneities and the 50 detectors (small dots). (b) Case 1: The reconstructed absorption including the middle fluorescing heterogeneity, interpolated onto the 17 × 33 × 33 grid used for prediction, and shown with the locations of the four sources used (open circles). (c) Case 2: The reconstructed absorption including the top and bottom fluorescing heterogeneities shown with the locations of the eight sources used (open circles). (d) Case 3: The reconstructed absorption of a homogeneous phantom shown with the locations of the four sources used (open circles). Although the phantoms and reconstructions were actually 8 cm in the vertical dimension, only the center 4 vertical cm are shown here.

