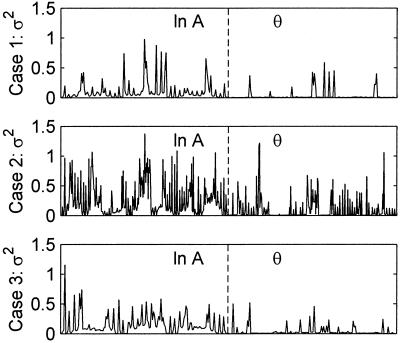
Figure 2.
Measurement error variance for each source-detector pair used in the inversions, shown for each of the three test domains. Measurement error variance of the referenced logarithm of AC amplitude is shown in the left half of each panel, and measurement error variance of referenced phase is shown in the right half of each panel.

