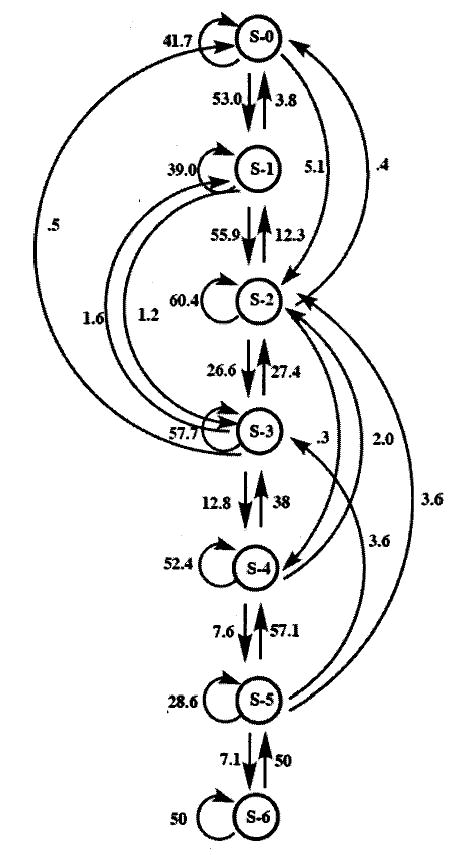
FIG. 3.

Kinematic diagram of first-order Markov chain analysis. Events are represented by circles (S-0 through S-6, depending upon number of modulations contained within the note). Transitions between events are depicted by arrows pointing away from an initial event and towards a following event. Recurrent arrows represent repetitions of initial events. Probabilities of transitions are found next to arrows.
