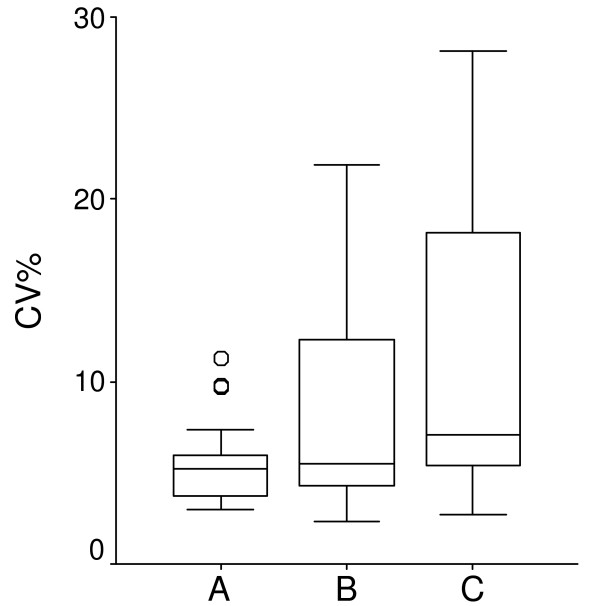
Figure 5.
The precision of the method. Box plot of CV% of 26 patient samples. For each sample, extraction was done in duplicates of 300, 600, and 900 μl (sextet from each patient) analysed and evaluated in three different ways, A is evaluated with the new algorithm and internal standard (IS), B is evaluated with the new algorithm and C is evaluated with the old algorithm. The Box-plot identifies the median, the middle 50% of the data, the range, and the outliers (o).

