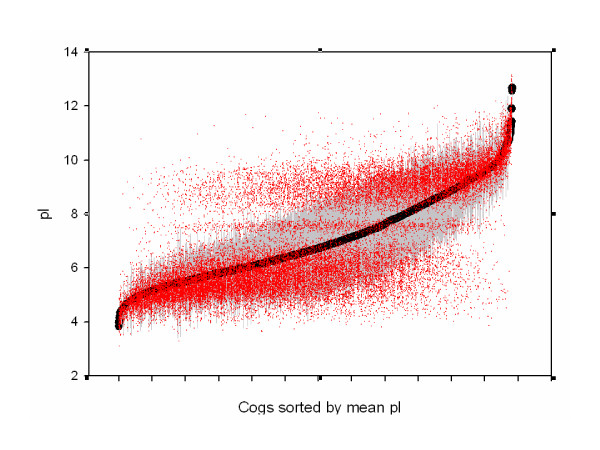
Figure 5.
Isoelectric point distribution of orthologs sorted by mean isoelectric point value. Black dot – mean value for COG, grey bar – standard deviation for COG, red point – pI value of individual genes classified under the COG. The sorted list of COG's used for the X-axis is available as an additional file.

