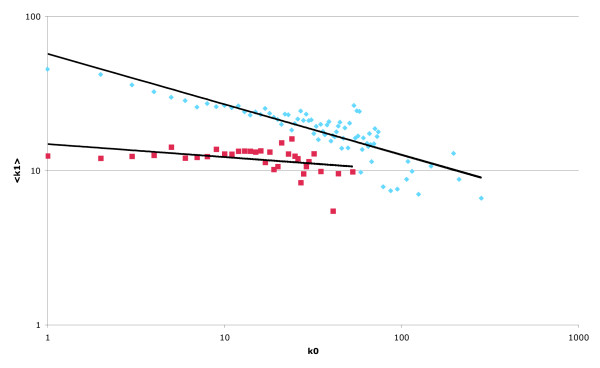
Figure 1.
DIP-based protein interaction network using the spoke model. Mean connectivity of neighbouring nodes (<k1>) as a function of the connectivity of the central node (k0) displayed on a log.-log. scale for the "global" network (blue) and "essential" sub-network (red), generated from interactions extracted from the yeast subset of the DIP database. Note the difference in topology between the two networks.

