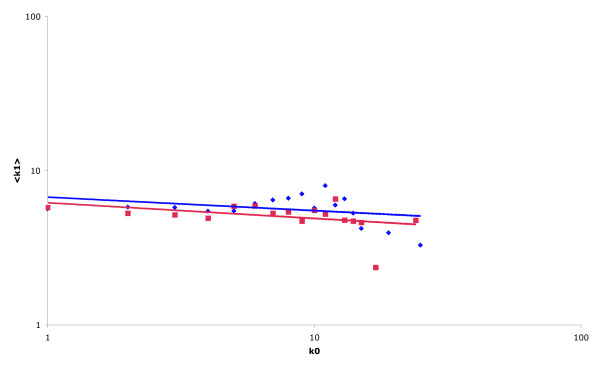
Figure 2.
Protein interaction network generated using the results of "small-scale studies" only. Average value of k1 as a function of k0 displayed on a log.-log. scale for the network of non-essential proteins (red) and essential proteins (blue) generated from a dataset including only protein interactions derived from small-scale studies. Both the global and essential networks display similar topological properties with both only exhibiting a very weak negative correlation.

