
Figure 8.
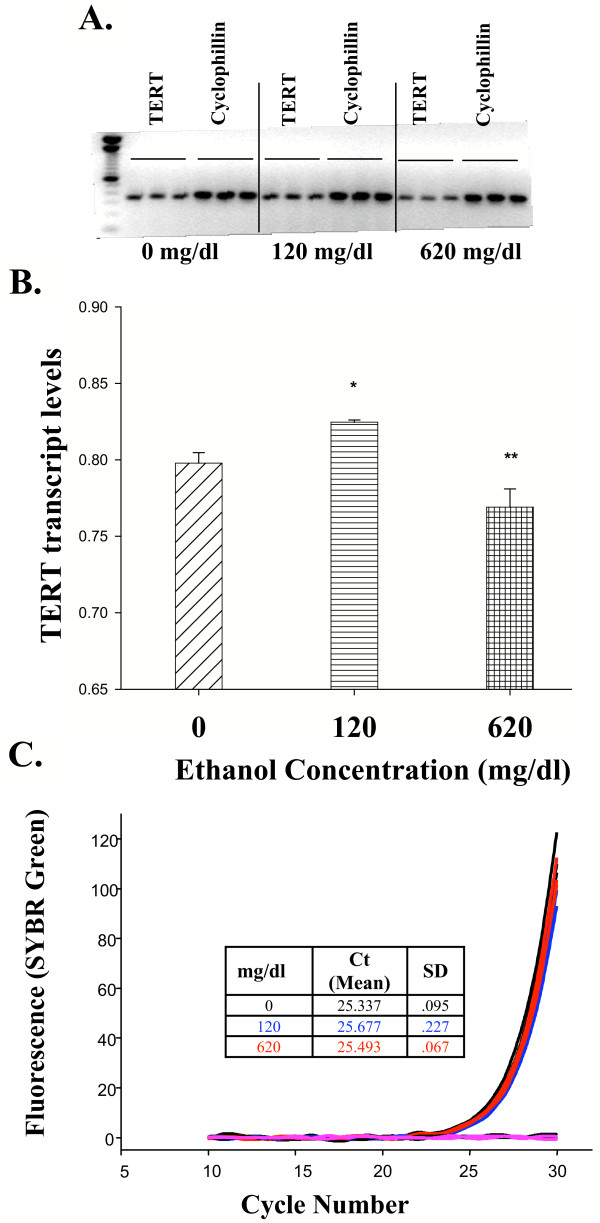
(A,B) TERT mRNA expression and telomerase activity in cortical-derived neurospheres treated with ethanol for 4 days. (A), RT-PCR for the TERT transcript. (B), Quantification of TERT levels in A, expressed as a ratio to cyclophilin. Low doses of ethanol modestly, but significantly, increased TERT transcript levels. However, high doses of ethanol decreased TERT mRNA expression. (C), TRAP assays revealed no differences in telomerase activity between treated and control groups. The cycle threshold value (Ct) indirectly measures activity; a lower Ct corresponds to higher telomerase activity. Inset table indicates Ct ± Standard Deviation (SD). Color code: Black, control; blue, 120 mg/dl; red, 620 mg/dl; pink, no-telomerase control. Asterisks indicate statistical-significance, p < 0.05.