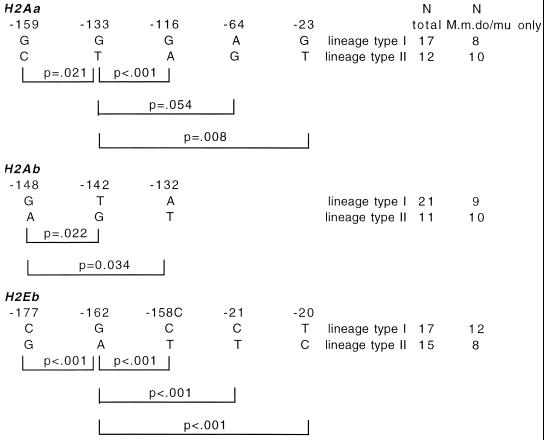
Fig 2.
Dimorphic promoter lineages. Linkage disequilibria are shown between the various major polymorphic positions labeled in Fig. 1, with probabilities calculated by Fisher's exact test. The bases are arranged as in the two basic lineages (types I and II).

