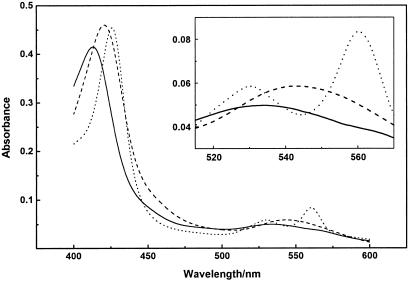
Figure 2.
Absorption spectra of the b-type cytochrome formed after the addition of heme to E. coli apo-CcmE′, showing the oxidized spectrum (——), the reduced spectrum obtained immediately after the addition of disodium dithionite (- - -), and the spectrum obtained after treating the ferric b-type complex with 2 mM potassium cyanide (– – –). Absorption spectra were recorded by using ≈5 μM b-type cytochrome in 50 mM sodium phosphate buffer, pH 7.0.

