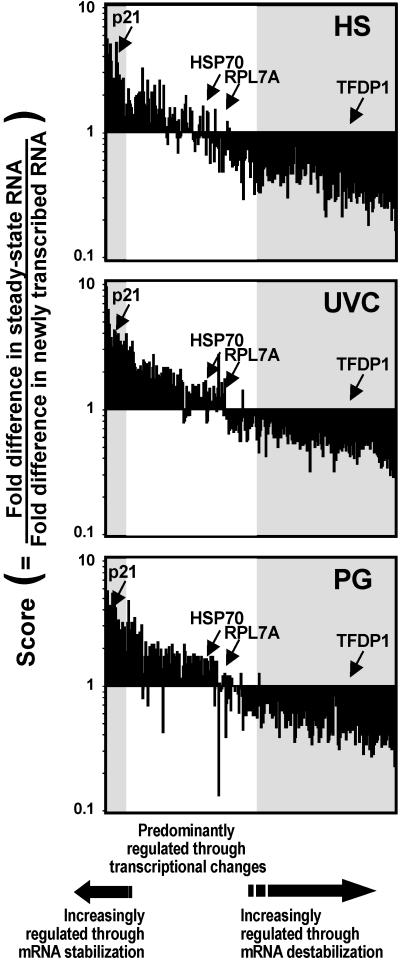
Fig 2.
Global assessment of stress-triggered alterations in mRNA turnover relative to stress-triggered alterations in gene transcription. Alignment of the stress-regulated 311 genes according to their score values, beginning with the genes with highest average scores on the left, then genes with progressively lower average scores toward the right. Shaded regions on the left highlight genes with scores >2 (encoding stress-stabilized mRNAs); shaded regions on the right highlight genes with scores <0.6 (encoding stress-destabilized mRNAs). Middle, white regions encompass genes with scores close to 1, whose stress-regulated expression is primarily modulated by changes in transcription. Representative genes from Groups II–V are shown.

