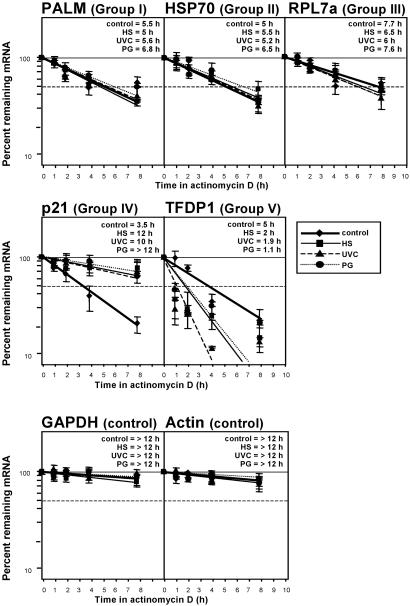
Fig 4.
Validation of stress-regulated changes in mRNA half-life. Following treatment of H1299 cells as described in Fig. 1, actinomycin D (2 μg/ml) was added and total RNA collected at various time intervals. Half-lives of mRNAs encoding genes of interest from each gene expression group (Table 1) were assessed after measuring Northern blot signals, normalizing them to 18S rRNA signals, and plotting them on a logarithmic scale. mRNA half-life is defined as the time period required to achieve a reduction of 50% (dashed horizontal line) of transcript. Data represent the means ± SEM of four independent experiments.

