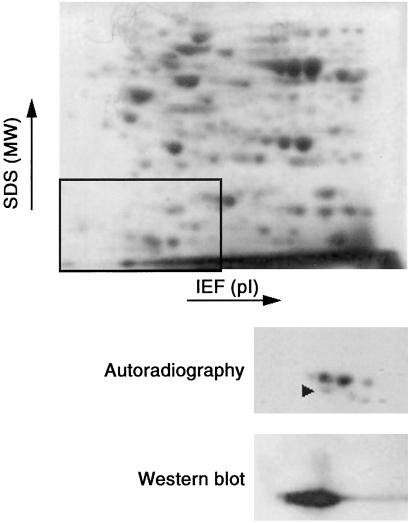
Figure 1.
Two-dimensional gel electrophoretic analysis of glutathionylated proteins. T cell blasts (106 per sample) were labeled with 35S, then exposed to 1 mM diamide for 5 min; the proteins were separated by isoelectrofocusing (pH range 4–10, left to right) and then by SDS/10% PAGE (migration from top to bottom). All runs were done under nonreducing conditions. Figure shows the portion of the gel where Trx is migrating. (Top) Coomassie blue staining. (Inset) Portion of the gel for which autoradiography and Western blot are shown. (Middle) Autoradiography. (Bottom) Immunoblotting with anti-Trx.

