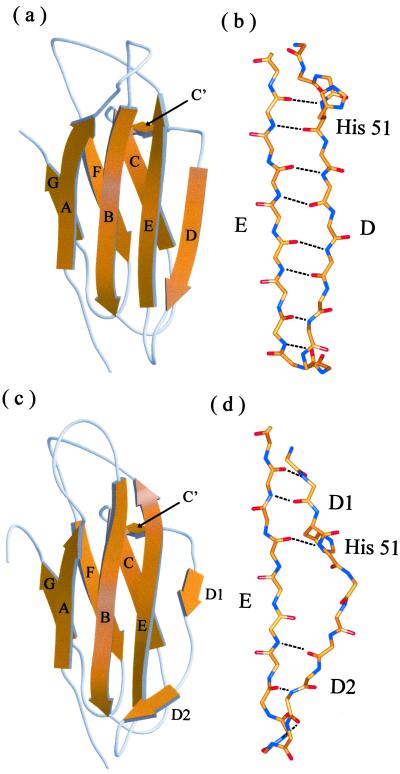
Figure 1.
Ribbon diagram of the crystal structures of (a) MHβ2m and (c) HLAβ2m. Detailed views of the conformation of residues 49–68 are also shown for (b) MHβ2m and (d) HLAβ2m. The structure of HLAβ2m was taken from PDB ID code 1DUZ (25). Individual β strands are labeled A although G. a and c were drawn by using the program MOLSCRIPT (37) and RASTER 3D (38) and b and d, by using SPOCK (39).

