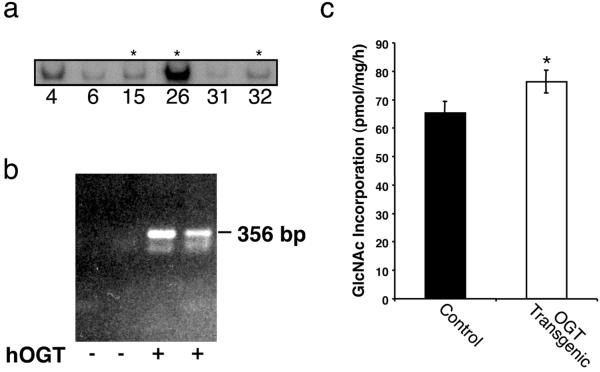
Fig 1.
OGT expression in control and transgenic mice. (a) Southern analysis of OGT transgenics (asterisks indicate three of the transgenic lines chosen for subsequent analysis). Isolated DNA from the founder mice was probed with an [α-32P]-labeled DNA fragment corresponding to 2.8 kb of the OGT coding region. (b) Presence of OGT cDNA products after RT-PCR of muscle and fat tissue. Quantification of human OGT mRNA transgene expression in muscle (lane 3) and fat (lane 4) was perfomed by RT-PCR. Lanes 1 and 2 represent control animals containing no transgene. (c) OGT activity in muscle of control and transgenic mice. Muscle from control and transgenic littermates was assayed for OGT activity by using casein kinase II as an acceptor peptide and measuring GlcNAc incorporation. (P < 0.05).

