Figure 1.
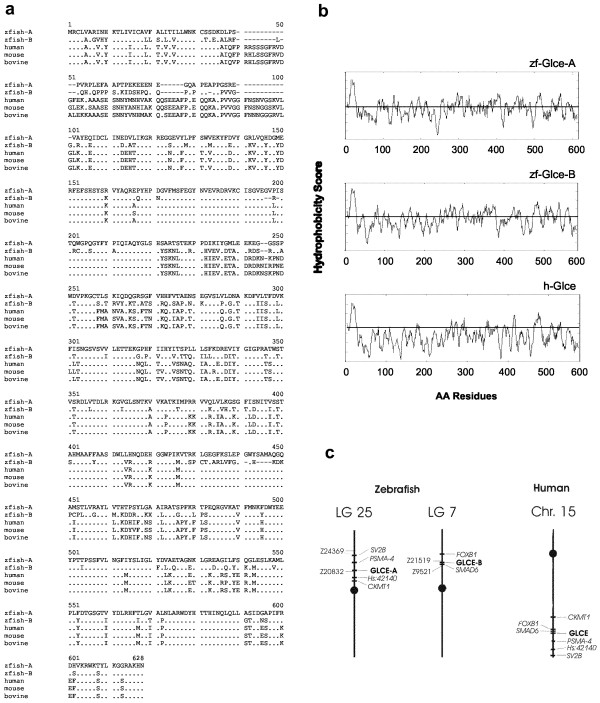
Cloning and structural analysis of zebrafish glce. (a) Alignment of Glce from zebrafish, human, mouse, and bovine. Conserved AAs are dotted. (b) Hydrophobicity plot of zebrafish and human Glce. Values above the line represent positive hydrophobicity scores. (c) Chromosomal mapping of zebrafish glce-A and glce-B and homology to the human Glce locus.

