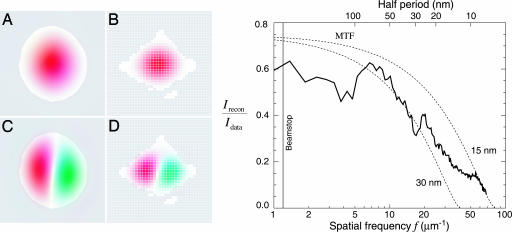
Fig. 2.
Technical details of the reconstruction of the diffraction data of Fig. 1. (Left) Because the very intense nondiffracted beam was blocked by a beamstop, no data were recorded at very low spatial frequencies. Shown here are two modes in the reconstruction superimposed on the missing data region of the detector (white pixels in the diffraction or Fourier space in B and D). We also show these modes in object space, superimposed on the support (allowed spatial region) of the yeast cell (A and C). The amplitudes of weakly constrained modes such as these are undetermined by our reconstruction. (Right) One measure of the quality of the reconstruction is the degree to which it reproduces the recorded data (diffraction intensities). The reconstructions of Fig. 3 are averages Irecon = | 〈Frecon 〉 | of many complex iterates Frecon of a phasing algorithm, each differing only in the values of their phases. Diffraction data that are reliably phased will add constructively, whereas data with phases that are inconsistent over many iterates will add randomly, leading to reduced intensity in the reconstruction compared to the recorded intensities Idata. The ratio Irecon/Idata is shown alongside the theoretical modulation transfer function (MTF) of conventional imaging optics with an efficiency of 75% and Rayleigh resolutions of 30 and 15 nm, respectively.

