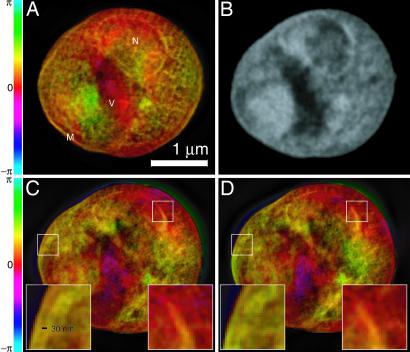
Fig. 3.
Images of a freeze-dried yeast cell. A was obtained by phasing the diffraction data in Fig. 1, whereas C and D were obtained from reconstructions of two separate, slightly lower exposure data sets acquired with the cell tilted by 3° (C) and 4° (D) relative to A (Movie 2, which is published as supporting information on the PNAS web site, displays reconstructed images at 1° intervals over a 7° range). Insets in C and D show ≈30-nm fine features at the cell and nuclear membrane regions that are reproduced consistently in these separate recordings and reconstructions, even though these 2D reconstructions are projections along the beam axis with some blurring as a result of defocus. The renderings of the complex-valued reconstructions use brightness to represent magnitude and hue to represent phase (the color scale indicates reconstructed phase values). A is labeled according to a provisional identification of the nucleus (N), a storage vacuole (V), and the cell membrane (M). B shows a National Synchrotron Light Source X1A2 STXM (27) image taken of the same cell using 540-eV x-rays and a zone plate with an estimated Rayleigh resolution of 42 nm; this image shows absorption effects only, so it is shown in grayscale. The STXM image is shown here for comparison purposes only; it was taken at a different photon energy and in a different contrast mode (incoherent brightfield) than applies to the reconstructed diffraction data. The information contained in the STXM image was not used in any way in obtaining the diffraction reconstruction.

