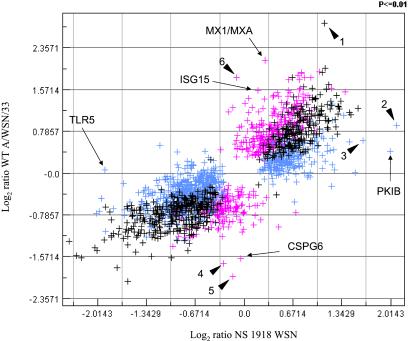
Fig 5.
Comparison of expression ratios for cellular genes during infection with wt influenza A/WSN/33 and NS/1918 viruses vs. mock-infected cells. Scatter plot of log2 ratios for genes that exhibited P values ≤0.01 in at least one of the two infections. Blue, Genes that were significantly up- or down-regulated during infection with 1918 NS recombinant virus; magenta, genes that were significantly up- or down-regulated during infection with wt A/WSN/33 virus; and black, genes that had P values ≤0.01 during both infections. Examples of genes with known cellular function and whose expression differs considerably between the two viruses are indicated by arrows and Human Genome Organization (HUGO) names. ESTs that exhibited differences in gene expression between WSN and NS 1918 virus-infected cells are indicated with solid arrow heads: 1, EST_134682; 2, EST_32376 (LOC51103); 3, EST_427797; 4, EST_207649 (KIAA1272); 5, EST_283495; 6, EST_795255.

