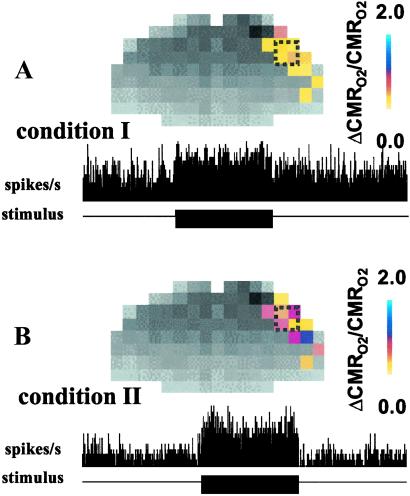
Fig 1.
Calibrated BOLD maps (Upper) of ΔCMRO2/CMRO2 (Table 1) and changes in spiking activity (Lower) extracted from extracellular recordings in cortical layer 4 (Table 2) during contralateral forepaw stimulation. The resting and stimulated signals were made under high basal activity (A, condition I) followed by low basal activity (B, condition II) in the same rats. For the fMRI measurements, the colored bar shows the scale for ΔCMRO2/CMRO2 from the respective baselines. For the electrophysiology measurements, the black bar shows the stimulation period where the horizontal axis represents 900 s of data acquisition and the vertical axis (same range in A and B) represents number of spikes per second (1-s bins). The magnitudes of changes in CMRO2 and spiking activity were greater from baseline of condition II.

