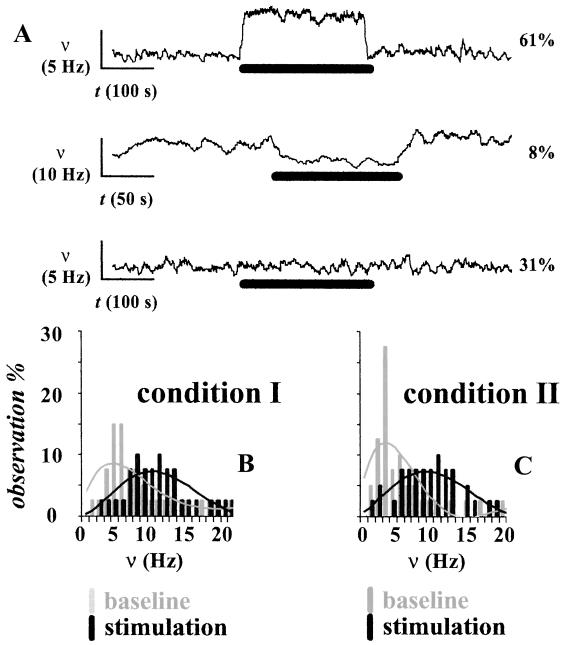
Fig 2.
(A) Experimental variations across electrophysiological measurements (shown for condition II only) from the contralateral forepaw region. Significant increases and decreases in ν were observed in ≈60% and ≈10% of the recordings, respectively (Top and Middle), whereas in ≈30% of the recordings the stimulation did not induce any significant changes in ν (Bottom). The vertical and horizontal bars represent the scales for ν and time, respectively (see text and Table 2 for details). The thick black horizontal bar represents the stimulus duration. (B and C) The comparison in a small neuronal ensemble (72 neurons; see Table 2) between basal activity achieved with two dosages of α-chloralose shows significantly different spiking frequencies at rest (P < 0.01), whereas on stimulation the spiking frequencies became similar (P > 0.25).

