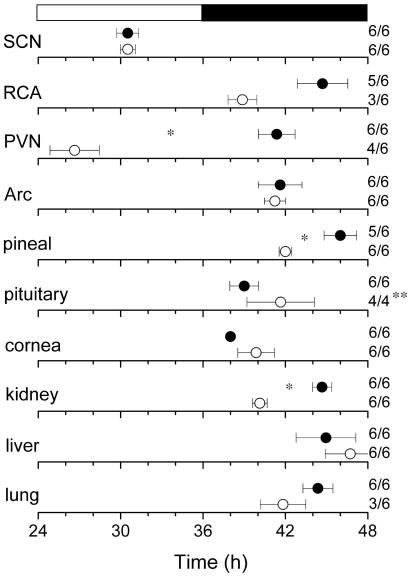
Fig 5.
Phase map for central and peripheral circadian oscillators. The peak of the circadian oscillation was determined during the interval between 12 h and 36 h in culture. The average times (± SEM) of peaks were plotted against the time of last lights-on. •, data from young rats; ○, data from aged rats. The light–dark cycle to which the animals were exposed before killing (black and white bar) is shown at Top. (Right) The sample size is shown (number of rhythmic tissues/number of tissues tested). *, Statistically significant (P < 0.01, t test); **, the pituitary in two aged rats had tumors and consequently were excluded from the analysis. Arc, arcuate nucleus.

