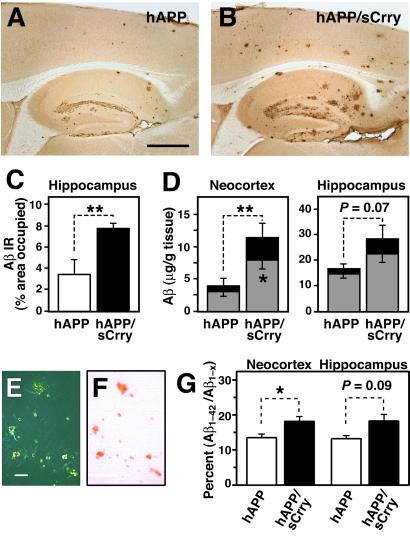
Fig 2.
Increased Aβ accumulation and amyloid formation in hAPP/sCrry mice. (A– F) Brains from 10- to 12-month-old hAPP (n = 6) and hAPP/sCrry (n = 8) mice were dissected and analyzed for Aβ accumulation and amyloid formation. (A and B) Aβ immunostaining in the hippocampus and neocortex of an hAPP (A) and an hAPP/sCrry (B) mouse. (C) The area occupied by Aβ immunoreactivity was significantly larger in hAPP/sCrry than in hAPP mice. Values are mean ± SEM. **, P < 0.01 by t test. (D) Total Aβ (Aβ1-x, black + gray bars) and Aβ1–42 levels (gray bars) in neocortex and hippocampus of hAPP and hAPP/sCrry mice. Values are mean ± SEM. **, P = 0.028; *, P = 0.039 by t test. (E and F) Congo red staining in the hippocampus of an hAPP/sCrry mouse viewed with crosspolarized filters (E) or under normal light (F). (G) Aβ1–42/Aβ1-x ratios in neocortex and hippocampus of 3-month-old hAPP/sCrry (n = 9; black bars) and hAPP (n = 8; white bars) mice as measured by ELISA. Values are mean ± SEM. *, P < 0.05 by t test. [Scale bars: 250 μm (A and B), 100 μm (E and F).]

