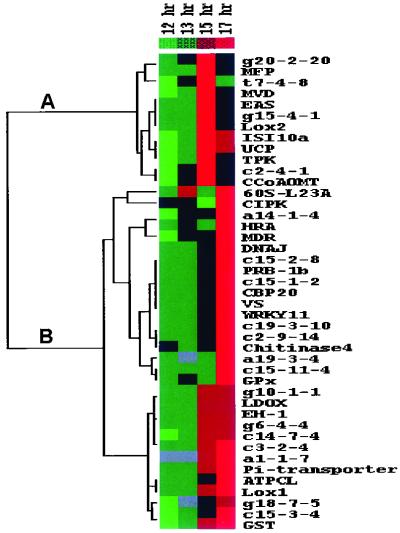
Fig 4.
Clustered display of data from time course expression analysis during pretreatment with 0.1 μM MV. Expression of induced genes isolated by mRNA differential display and of GPx was analyzed during the last 5 hr of pretreatment with MV. Control expression values of samples pretreated with water were subtracted from those pretreated with MV. Data were variance-normalized and subjected to hierarchical cluster analysis (see Materials and Methods). Each gene is represented by a single row of colored boxes and each time point by a single column. Induction (or repression) with respect to mean expression over the four time points ranges from pale to saturated red (or green). Gray boxes are missing values. (A) Node of the clusterogram with the early-response genes. (B) Node of the clusterogram with late-response genes.

