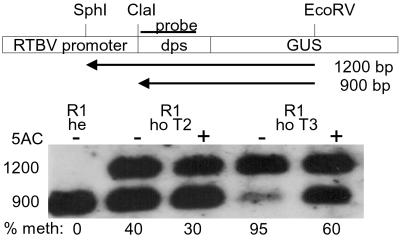
Fig 4.
Methylation analysis of the ClaI site at the 5′ end of the transcribed region. A schematic presentation of the fragments obtained by ClaI, EcoRV, and SphI digestion with methylated and nonmethylated ClaI sites is shown (dps, downstream promoter sequences) together with the resulting Southern blot. 5-AC, seedlings germinated in the presence (+) or absence (−) of 5-AC; he, hemizygous; ho, homozygous; % meth, relative amounts of methylated DNA.

