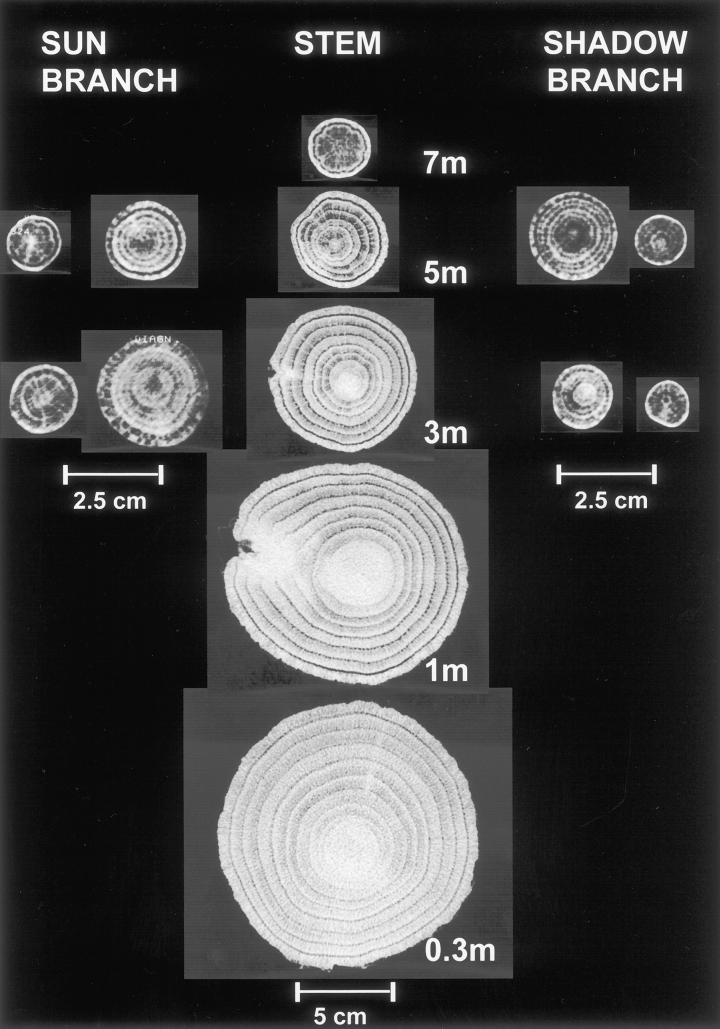
Figure 3.
CT images of the stem as well as sun and shadow branches of a 12-year-old oak tree. Bright heartwood of the 0.3-, 1-, and 3-m level indicates the formation of heartwood substances, whereas the sapwood rings show significant density differences between earlywood (dark) and latewood (bright). Width 2,024, center 11.

