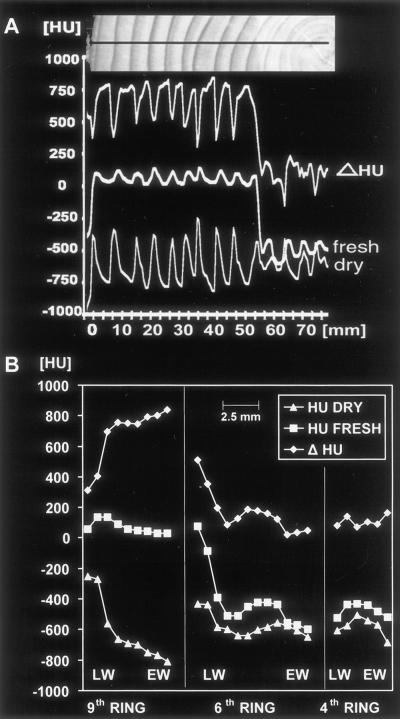
Figure 5.
Density and water profiles from growth rings of spruce. A, From the cambium to the second ring of the spruce images shown in Figure 4. To calculate the pure water content of the xylem, the Δ HU was established between the profiles taken from the fresh and the dried disc. All three profiles correspond to the black line of the optical image (photograph above) taken from the surface of the disc. Water content (Δ HU) shows maxima in the earlywood and minima in the latewood of the sapwood rings and thus corresponds inversely to the profile of the dried state (dry). B, Density (HU DRY) and water (Δ HU) profiles of three different growth rings. The curves on the left (ninth ring) show a strong reduction of water content (Δ HU) from earlywood (EW) to latewood (LW) but an increase in density (HU DRY). The sixth ring shows the change from sapwood to heartwood at the intermediary zone with a strong decrease in water content, whereas the fourth ring in the heartwood shows relatively low water and density values.

