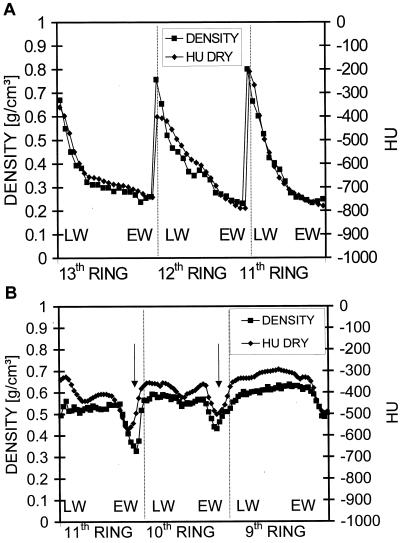
Figure 6.
Correlation between density profiles obtained with the traditional gravitometric-volumetric method and density profiles (HU DRY) extracted from the CT images. A, The curves represent the three outer rings of spruce with peaks corresponding to regions of latewood (LW). B, Density profiles of oak. Arrows indicate density mimima caused by wide luminous vessels. Vertical lines indicate ring boundaries. EW, Earlywood.

