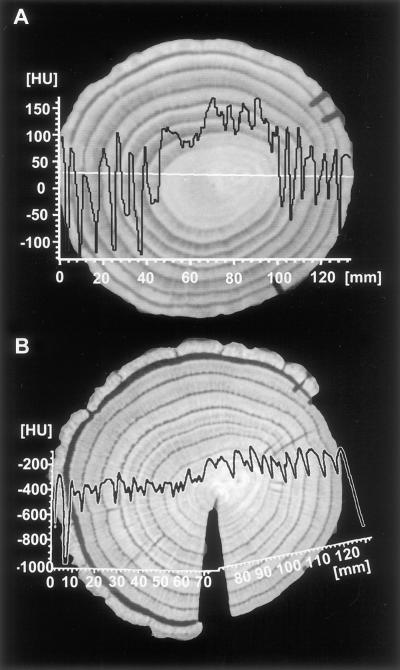
Figure 7.
Transverse CT images of oak taken at the 1.3-m level. A, Fresh state (width 1,458, center −271) and B, after oven drying at 103°C (width 1,216, center −544). Density profiles taken at the white line show an increase in the heartwood region as well as strong variations within each growth ring of the sapwood.

