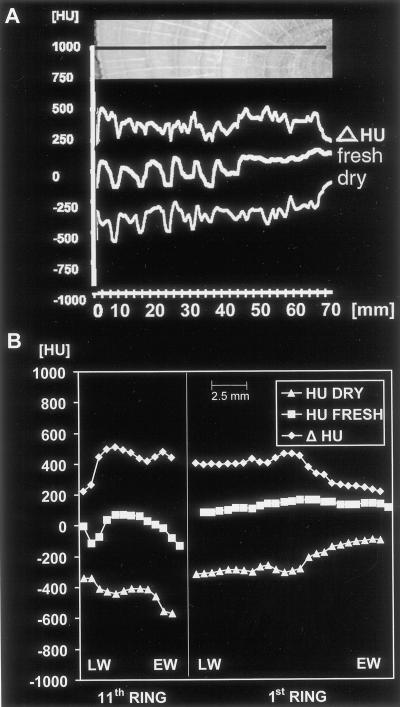
Figure 8.
Density and water profiles from growth rings of oak. A, From the cambium to the first ring of the images shown in Figure 7. All profiles correspond to the black line shown in the photograph above. Although water content (Δ HU) remains relatively stable throughout the whole profile, the density curve increases in the heartwood region (dry, right). Small deviations between the ring pattern of the photograph and the curves are caused by 2-cm height difference between the detected profiles (in the middle of the disc) and the optical image (at the surface). B, Density (HU DRY) and water profiles of a sapwood (11th) and heartwood (first) ring. In the sapwood, water content (Δ HU) decreases in the latewood (LW), whereas wood density (HU DRY) increases. In contrast, in the earlywood (EW) of the first ring density increases and water content decreases (right).

