Figure 2.
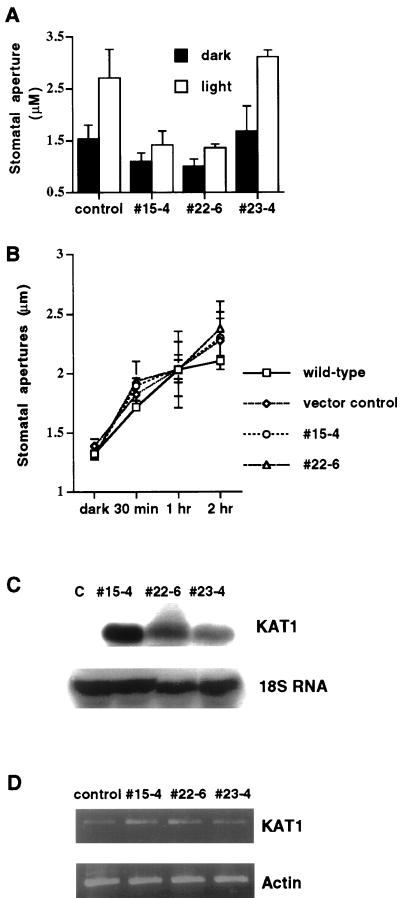
Inhibition of light-induced stomatal opening in transgenic K+in channel depressor lines numbers 15-4 and 22-6 in which expression of dominant negative KAT1 mutant is driven by a tandem-repeat of the 35S promoter, and detection of transgenic dominant negative KAT1 transcripts in the guard cells of depressor lines. A, Stomatal aperture before treatment with stomatal opening conditions (black bars). Stomata were exposed to light for 3 h in 30 mm KCl (white bars; vector-transformed control, n = 5 [100 stomates]; line no. 15-4, n = 3 [60 stomates]; line no. 22-6, n = 3 [60 stomates]; line no. 23-4, n = 2 [40 stomates]). Error bars show se B, Time course measurements of stomatal apertures at high extracellular (100 mm) K+. Stomata were incubated in 100 mm KCl and measured at 30 min, 1 and 2 h after light exposure (n = 2 experiments, 40 stomates were measured at each time point). Error bars show se C, RNA-blot analysis of transgenic dominant negative KAT1 transcripts in wild-type controls (c) and in transgenic line numbers 15-4, 22-6, and 23-4. Total cellular RNA was extracted from leaves of plants, separated on a 1.2% (w/v) denaturing agarose gel, and then transferred onto a nylon membrane. The blot was probed with 32P-radiolabeled KAT1 cDNA. The same blot was hybridized with 32P-radiolabeled 18S rDNA to show relative amounts of RNA samples loaded. D, Reverse transcriptase (RT)-PCR analysis of endogenous and transgenic KAT1 transcripts in guard cells of wild-type controls and in transgenic line numbers 15-4, 22-6, and 23-4. The same amount of cDNA was used to amplify actin, to determine relative amounts of cDNA used for KAT1 amplification. The average from three independent pooled PCR amplifications of actin and KAT1 transcripts is shown.

