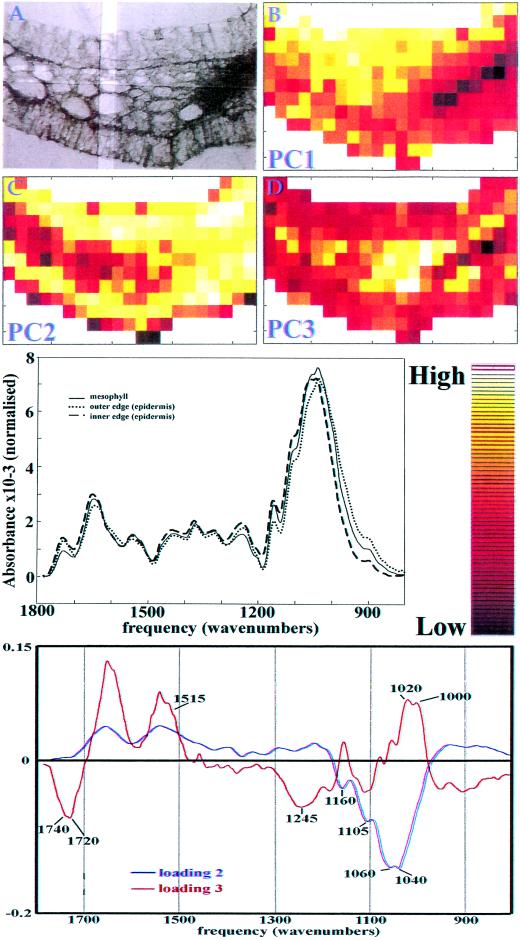
Figure 1.
A, Brightfield micrograph of the coleoptile section using mirror optics in the IR microscope. An example of the area from which IR data is sampled is delimited by a pair of double-bladed apertures. B–D, Calculated scores of principal component (PC) 1, PC2, and PC3, respectively, displayed as chemical images. Middle, Average spectra of mesophyll cells, and the inner and outer edges of the outer epidermis are different from each other. The color gradient used in chemical images in Figures 1 and 2 corresponding to peak intensities is shown on the right. Bottom, Corresponding loadings for PC2 and PC3 with peaks of interest marked.

