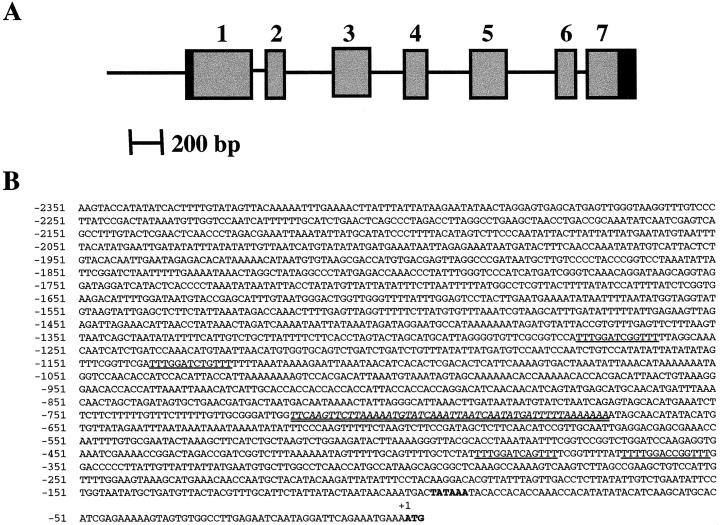
Figure 7.
A, Diagrammatic representation of the structure of the sAPase gene from lupin. Exons are indicated by boxed regions, while introns and the 5′ non-transcribed region are represented by lines. The blackened portion of exons 1 and 7 correspond to the untranslated sequences. B, Sequence of the 5′-upstream region of the sAPase gene. The translational start codon and the putative TATA box are shown in bold. The repeats with consensus core sequence 5′-TTTGGAPyCNGTTT-3′ are underlined. The 50-bp region with 72% sequence identity to the Arabidopsis APase promoter is indicated in italics and double underlined.

