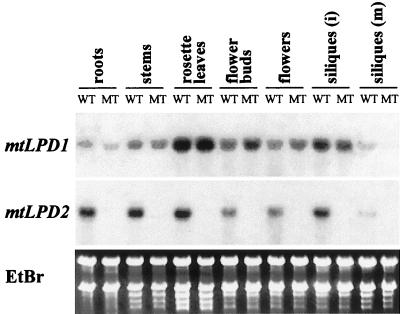
Figure 5.
mtLPD RNA expression in different organs comparing wild type and T-DNA mutant, mtlpd2. Five micrograms of RNA from different organs was loaded in each lane with WT representing wild type and MT the mtlpd2 mutant. Hybridization was performed with the 3′-UTR of each gene as indicated. Ethidium bromide staining shows equal RNA loading.

