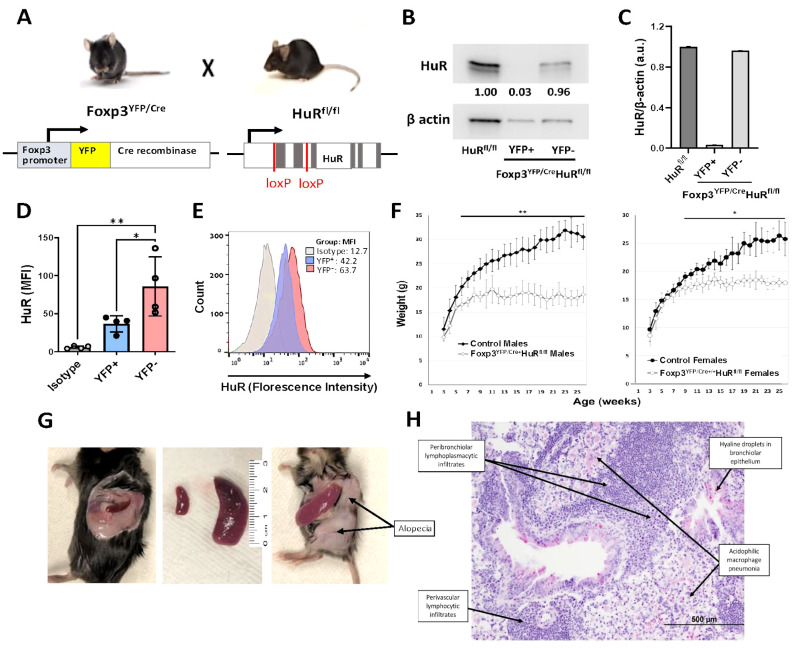
Figure 1.
Treg-specific ablation of HuR in Foxp3 YFP/Cre HuR fl/fl mice results in severe failure to thrive (FTT) and systemic spontaneous autoimmunity. (A) Schematic illustrating conditional deletion of HuR in Tregs in the Foxp3 YFP/Cre , HuR fl/fl (HuR-KO Tregs) mouse model. (B) Western blot of HuR protein in sorted YFP+ (HuR-null) versus YFP− Treg populations showing near-complete HuR deletion in YFP+ cells, with β-actin as loading control. (C) Quantification of HuR/β-actin protein levels from western blots, showing HuR reduction in YFP+ Tregs compared to controls. (D) Bar graph of HuR mean fluorescence intensity (MFI) in YFP+ versus YFP− Tregs and isotype control, showing significant HuR reduction in YFP+ Tregs (mean ± SD, p < 0.05 by unpaired t-test, n = 4). (E) Flow cytometry histogram representative showing HuR expression profiles in YFP+, YFP−, and isotype control populations. (F) Body weight monitored from 3–26 weeks in male and female Foxp3 YFP/Cre , HuR fl/fl (open symbols) versus controls (solid symbols). Both male and female HuR-deficient mice exhibited severe growth impairment (males plateaued at 18.5 ± 1.2 g vs. 31.5 ± 1.6 g in controls, p < 0.01; females plateaued at 18.3 ± 1.0 g vs. 26.5 ± 2.4 g in controls, p < 0.05). Two-way repeated measures ANOVA showed significant genotype effect. (G) Clinical phenotype in Foxp3 YFP/Cre , HuR fl/fl mice including splenomegaly, alopecia, and tail stippling. (H) Representative H&E lung section from Foxp3 YFP/Cre , HuR fl/fl mice demonstrating perivascular and peribronchiolar lymphoplasmacytic infiltrates, acidophilic macrophage pneumonia, and hyaline droplets in bronchiolar epithelium. Representative data are shown from at least 8 mice for panels F-H. The age of the mice at the time of analysis was 6–7 months. *p<0.05, **p<0.01.

