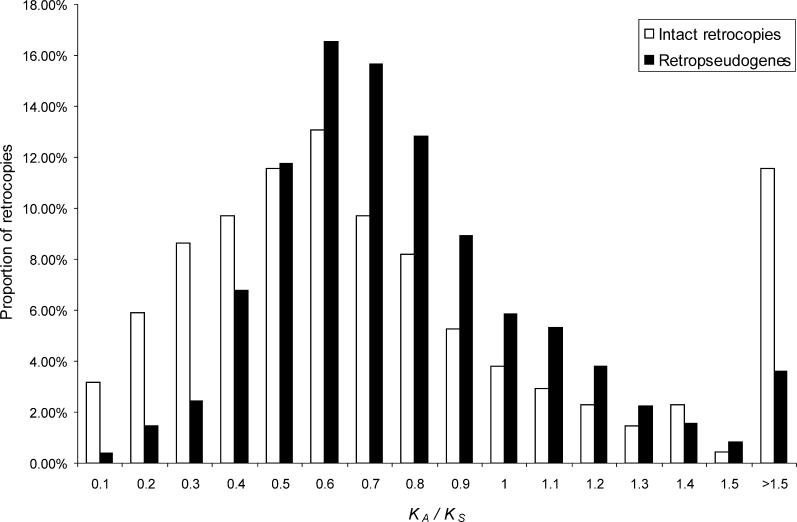
Figure 2. KA /K S Distributions for 475 Intact Retrocopies and 1,554 Retropseudogenes with K S < 0.15.
Note that we tested that the differences observed for K A /K S < 0.5 are not explained by differences in GC content (see Materials and Methods for details). The bin with K A /K S > 1.5 includes estimates where K S = 0 (K A /K S = ∞).

