

Abstract
Influenza A viruses remain a persistent public health concern due to their extensive genomic diversity and seasonality. Among the mechanisms driving their evolution, reassortment plays a pivotal role by facilitating the exchange of gene segments between co-infecting viruses, leading to novel viral genotypes. This mechanism contributes to pandemic strains, such as the 2009 H1N1 pandemic (H1N1pdm), and affects seasonal influenza by introducing genetic changes with potential impacts on viral traits and clinical outcomes. Comprehensive reassortment analysis is therefore critical for better understanding the mechanisms underlying influenza virus evolution and their potential impact on public health. A new visualization tool, Crossing lines Annotating with Tanglegrams on Trees (CatTrees), was designed to enhance the presentation of reassortment events in multiple phylogenetic trees. To facilitate this workflow, we developed the Virus Data Analysis Toolkit (VIDA), a modular Python toolkit that automates and standardizes viral sequence preprocessing and downstream analyses. This integrated approach was successfully applied to whole genomes of influenza A(H1N1)pdm from 2019 to 2023. Notably, a novel group named reassortment 6B.1A.5a.1 (in short, re6B.1A.5a.1 or re5a.1) emerged during the 2020–21 season and became dominant in the Netherlands, France, Togo, South Africa, and Kenya in 2021–22, eventually replacing the original clade 6B.1A.5a.1 in the 2022–23 season. Three reassortment patterns were observed, in which clade 6B.1A.5a.1 reassorted with clades 6B.1A.5a and 6B.1A.5a.2. These patterns shed light on the ongoing evolution of influenza viruses.
Keywords: influenza, H1N1pdm, reassortment, data visualization, phylogenetic tree
Introduction
Influenza A virus (IAV) belongs to the Orthomyxoviridae family, possesses eight single-stranded negative-sense RNA segments, and exhibits a reassortment evolution mechanism. The eight gene segments encode polymerase basic 2 (PB2), polymerase basic 1 (PB1), polymerase acidic (PA), hemagglutinin (HA), nucleoprotein (NP), neuraminidase (NA), matrix (M), and non-structural (NS). A novel combination of genes carried by a virion results from the mechanism of reassortment, which occurs when two distinct viruses co-infect the same host and exchange gene segments (McDonald et al. 2016). Notably, reassortment has been one of the key factors contributing to several well-known pandemics throughout history, including the 1957 Asian pandemic H2N2, the 1968 Hong Kong pandemic H3N2, and the 2009 H1N1 pandemic (H1N1pdm) (Harrington et al. 2021). Moreover, reassortment occurs in seasonal influenza, occasionally leading to significant changes that alter viral characteristics or clinical manifestations (Steel and Lowen 2014). For instance, the emergence of H3N2 reassortment associated with clade 3C.2a2 occurred during the 2017–18 season, resulting in higher viral fitness and clinical severity than the parental strains (Liu et al. 2024).
Given reassortment’s profound impact on viral evolution, various computational approaches have been developed to detect reassortment events. Many rely on the comparison of phylogenetic trees, such as the Graph Incompatibility-based Reassortment Finder (GiRaF) (Nagarajan and Kingsford 2010), Recombination Detection Program (RDP) (Martin et al. 2021), and the TreeKnit method (Barrat-Charlaix et al. 2022). Beyond these tree-centric tools, there are alternative methods that do not hinge on phylogenetic trees. One such method is SimPlot++ (Samson et al. 2022), which visualizes similarity patterns across aligned sequences using a sliding-window approach. Another example is the Host-prediction-based Probability Estimation of Reassortment (HopPER) approach (Yin et al. 2020). Gong et al. (2021) also proposed a novel reassortment detection method based on a self-organizing map.
Despite these advances, current methods often fall short in visualizing reassortment patterns clearly and intuitively. Genomic constellation heatmaps and multi-tree comparisons are commonly used (Hassan et al. 2020, Venkatesh et al. 2020, Liu et al. 2021, He et al. 2022), but they tend to produce complex outputs that obscure signals of phylogenetic incongruence. For example, a heatmap filled with various colour blocks denoting different clades can make it difficult to pinpoint strains that may have undergone reassortment events in a large-scale dataset. Similarly, when comparing several trees in a single plot, the entanglement of lines connecting different strains can hinder the interpretation of reassortment patterns. This overload of graphical information can ultimately lead to diminished focus and reduced clarity in the analysis. More importantly, the need to rerun the entire analysis when incorporating new data further complicates the process.
Moving forward, it will be imperative to continue monitoring IAV and identify any potential reassortment strains. This highlights the urgent need for improved visualization techniques to better elucidate the incongruities in reassortment patterns and enhance their interpretability. Therefore, in this study, a data visualization tool for phylogenetic incongruence, along with a pipeline for data processing, was designed and applied to decipher the recent evolutionary patterns of 2019–23 H1N1pdm.
Materials and methods
Data collection
H1N1pdm sequences (n = 10 055) from 1 September 2019 to 20 March 2023 were retrieved from the Global Initiative on Sharing All Influenza Data (GISAID) (https://www.gisaid.org/) (Shu and McCauley 2017) on 21 September 2023 (Supplementary Table S1). A data preprocess for filtering sequencing-biased data (Fig. 1) was performed to ensure the sequence quality. To further reduce computational load, a small number of qualified sequences (n = 471), selected from 1 September 2020 to 30 April 2022, was isolated to monitor reassortment events during the COVID-19 pandemic. This dataset included 6B.1 (n = 1), 6B.1A.5a (5a, n = 4), 6B.1A.5a.1 (5a.1, n = 371), 6B.1A.5a.2 (5a.2, n = 14), 6B.1A.5a.2a (5a.2a, n = 80), and 6B.1A.5b (5b, n = 1). Additionally, for a comprehensive view of the reassortment patterns from 2019 to 2023, focusing on the five major circulating clades (5a, 5a.1, 5a.2, 5a.2a, and 5a.2a.1), two sequences were randomly chosen from a pool of sequences collected during the same month for each year and country, reducing the total sequence count to 3315. These downsampled sequences contained 5a (n = 317), 5a.1 (n = 1217), 5a.2 (n = 384), 5a.2a (n = 760), and 5a.2a.1 (n = 637) clades.
Figure 1.
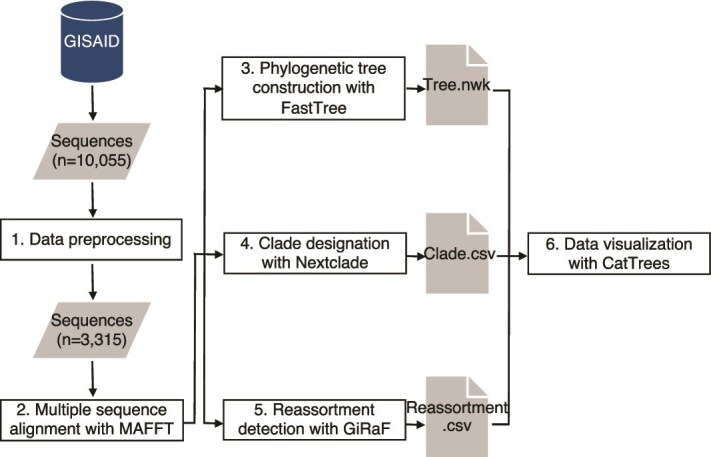
The overall methodologies of our data analysis pipeline. Six steps include (1) data preprocessing, (2) multiple sequence alignment, (3) phylogenetic tree analysis, (4) clade designation, (5) reassortment detection, and (6) data visualization with the CatTrees app.
Analysis pipeline
Five major steps were followed to generate the files required for data visualization: data preprocessing, multiple sequence alignment, phylogenetic tree analysis, clade designation, and reassortment detection (Fig. 1). First, incomplete or sequencing-biased data, such as sequences with Ns > 3% and partial sequences, were filtered. Second, quality sequences were aligned using MAFFT (version v7.508) (Katoh and Standley 2013). Third, FastTree (version 2.1.10) (Price et al. 2010) was used to generate maximum likelihood (ML) trees. Fourth, clade designation was performed using the Nextclade (Aksamentov et al. 2021). Finally, we employed GiRaF to identify potential reassortant strains. To streamline this multi-step process, we developed a modular and extensible Python package called the Virus Data Analysis Toolkit (VIDA). VIDA provides a Linux shell script to automate data processing steps, including FASTA header cleaning, segment splitting, ambiguous base filtering, downsampling, and eight-segment genome completeness checks for influenza viruses. It also integrates alignment and clade assignment tools to facilitate automated file preparation and reproducible analysis for downstream visualization. To ensure transparency and reproducibility, all source code is publicly available, along with an environment file created using Conda (version 23.3.1) for reconstructing the software environment.
Interface and functions of Crossing lines Annotating with Tanglegrams on Trees (CatTrees)
Tanglegram (Galili 2015) is a common method for presenting reassortment patterns by demonstrating incongruence between two phylogenetic trees, typically for HA and NA in influenza viruses. We aim to extend the application of tanglegram. A new web interface, called CatTrees, was created to visualize reassortment patterns across two or more trees (Fig. 2), implemented using the R Shiny application (Borges et al. 2024). The three required files to generate the graph contain the phylogenetic trees, lists of clades (or lineages), and reassortment strains. The left sidebar in Fig. 2 shows three boxes for uploading files generated from the pipeline, including trees in a Newick format and the information on reassortment and clades in a comma-separated values format. After importing the required files, the graph is automatically displayed on the right side. The plot of trees was constructed using the ggtree package (Yu 2020) in R language, which was used to colour customized clades. Individual tips in each tree are connected through grey lines, some of which are coloured red to highlight the reassortment strains. Moreover, the ‘Settings’ menu item was designed to modify the distance between trees as well as the size of lines and points. The ‘Rescaling the plot’ menu item was utilized to set up the width (pixels), height (pixels), and resolution (pixels per inch; ppi) of the graph. Eventually, a download button below the main graph was designed to save the graph.
Figure 2.

CatTrees interface. The input files for phylogenetic trees, reassortment strains, and clades were uploaded via the three file inputs. Users had the option to modify the graph through the ‘Settings’ menu and the ‘Rescaling the plot’ item to adjust the image size and resolution. The plot could be saved by clicking the Download button. Phylogenetic incongruence was displayed on the right side. Additionally, the filename for each tree segment was shown at the bottom of the corresponding trees.
Geographic distribution of sequence data
To illustrate the composition of the reassortment clade among the top 20 countries, a pie chart was generated using the Plotly package (v4.10.2) in R. Each country is labelled with its respective proportions. As the colours shifted towards darkness, the proportion increased. Countries with < 1% representation were grouped under others.
Results
Reassortment detection of the 2020–21 and 2021–22 seasons
To monitor genomic variation from 2020 to 2022, we retrieved 471 complete H1N1pdm genomes, each comprising eight segments, spanning seven clades. All preprocessing steps were performed using our custom VIDA toolkit. Among these strains, 392 were identified as reassortment strains by GiRaF, consisting of 362 sequences from the 5a.1a clade and 30 from the 5a.2a clade. Our visualization tool, CatTrees, revealed a group derived from the 5a.1 clade named re5a.1, which exhibited novel reassortment patterns (Fig. 3). We then further analysed H1N1 strains from 2019 to 2023. Although the dataset with four seasons (n = 3315) was too large to perform a comprehensive detection of reassortment, CatTrees could show the same pattern as that of re5a.1.
Figure 3.

Reassortment detection from 2020 to 2022. Eight segments from left to right: HA, MP, NA, NP, NS, PA, PB1, and PB2. The lines highlight 392 sequences identified by GiRaF, consisting of 362 sequences from clade 5a.1, renamed as re5a.1, and 30 sequences from clade 5a.2a. Re5a.1 reassorted with 5a.2 in the PA, PB1, and PB2 segments, and with 5a.2a in the NS segment. Additionally, this graph depicts the three distinct reassortment patterns within the re5a.1 subgroup.
Co-circulation of multiple subclades
Analysis of the downsampled H1N1 dataset (n = 3315) focused on five major circulating clades. Clades 5a.1 and 5a.2 were dominant in the 2019–20 season. Starting in the 2021–22 season, a new variant called 5a.2a emerged, characterized by six significant amino acid mutations (K54Q, A186T, Q189E, E224A, R259K, and K308R) in the HA1 domain. Subsequently, the subclade 5a.2a.1 emerged, co-circulated with 5a.2a, and became one of the dominant clades. Clade 5a.2a.1 exhibited three amino acid substitutions (P137S, K142R, and D260E) (https://www.crick.ac.uk/research/platforms-and-facilities/worldwide-influenza-centre/annual-and-interim-reports, February 2023 interim report). In addition to the derivations of 5a.2, a cluster detected in 5a.1 as re5a.1 (n = 348) showed reassortment patterns that began to emerge during the 2020–21 flu season (Fig. 4). This cluster was characterized by nucleotide mutations (A1469G, T1310C, A1415G, and A1421G) (https://nextstrain.org/seasonal-flu/h1n1pdm/ha/2y). Notably, re5a.1, reassorted with 5a.2 in the NA segment and was characterized by an amino acid change T16A, which was absent in both the 2022–23 northern hemisphere vaccine strain A/Victoria/2570/2019 and the 2023 Southern Hemisphere vaccine strain A/Sydney/5/2021.
Figure 4.

HA and NA trees of the downsampled dataset. On the left side of the display, the HA tree is shown, while the NA tree is on the right side. All the mutations labelled in the graph were manually added. Notably, re5a.1 did not exhibit any mutations in the HA protein. However, an interesting T16A mutation was observed in the NA protein of re5a.1, which was generated from reassortment between re5a.1 and 5a.2.
Residue changes of viral ribonucleoprotein in reassortment strains
Viral ribonucleoprotein (vRNP) subunits are derived from the translation of the RNA segments PB2, PB1, PA, and NP. Analysis of the vRNP subunits using CatTrees (Fig. 5) based on clade information from the HA tree located on the far left, revealed several reassortment events in the four gene segments. In the NP tree, clade re5a.1 did not branch from 5a.1 but from 5a. For the PA and PB1 segments, re5a.1 can be further divided into two distinct subgroups: 2020–23 1:1:6 (HA:NP:others) re5a.1 and 2021–23 2:1:5 (HA,PB1:NP:others) re5a.1. In the 1:1:6 re5a.1 subgroup, reassortment occurred between 5a.2 and re5a.1 in both the PA (I129M mutation) and PB1 (E739D mutation) segments. Within the 2:1:5 re5a.1 subgroup, reassortment was observed between 5a.2 and re5a.1 in the PA segment with a specific K256Q mutation. However, no reassortment was identified in the PB1 segment despite the presence of a D154N mutation. In the PB2 segment, re5a.1 reassorted with 5a.2, and both clades exhibited the I81M mutation.
Figure 5.

Genetic reassortment pattern of viral ribonucleoprotein. From left to right, HA, NP, PA, PB1, and PB2 are displayed. The lines indicate the reassortment events of re5a.1. Re5a.1 reassorted with 5a.2 in the PA, PB1, and PB2 trees, and with 5a in the NP tree. Mutations of protein residues were manually labelled. The I129M and E739D mutations in the 1:1:6 re5a.1 group are shown in the PA and PB2 trees, respectively. The 2:1:5 re5a.1 group acquired the K256Q and D154N mutants in the PA and PB1 trees, respectively.
Three reassortment patterns in the 6B.1A.5a.1 clade
In addition to the other six segments discussed in the previous section, MP and NS exhibited distinct patterns (Fig. 6). Within both phylogenetic trees, re5a.1 primarily branches off from the 5a.2 clade. However, an interesting divergence was observed: re5a.1 showed higher genetic similarity with 5a.2a in the NS segment, while it demonstrated greater resemblance to 5a.2a.1 in the MP segment, a pattern not observed in other segments. Furthermore, a smaller subgroup of re5a.1 (n = 29), originating from 5a, was exclusively identified during the 2021–23 season. Upon further investigation, this subgroup in the PA and PB1 segments, initially classified as the 2021–23 2:1:5 re5a.1 pattern, was reclassified as the third pattern, 2021–23 2:2:4 (HA,PB1:NP,NS:others) re5a.1.
Figure 6.

Multiplex reassortment in MP and NS. Three ML trees arranged from left to right, representing the timescales of HA, MP, and NS. The graph depicts the occurrence of reassortment events between re5a.1 and clades 5a, 5a.2, 5a.2a, and 5a.2a.1.
To visualize the differences among the three reassortment patterns of re5a.1, we constructed a hybrid plot (Fig. 7). Both 5a.1 and 5a.2 can be traced back to 5a during the 2019–20 season. Starting from the 2020–21 season, a new reassortment pattern emerged: HA from 5a.1, NP from 5a, and others from 5a.2, forming a 1:1:6 (HA:NP:others) configuration. In the subsequent 2021–22 season, HA and PB1 from 5a.1, NP from 5a, and others from 5a.2, were reconfigured to establish a 2:1:5 (HA,PB1:NP:others) pattern. Moreover, a minor subgroup characterized by a 2:2:4 (HA,PB1:NP,NS:others) arrangement, with the NS gene deriving from 5a, diverged from the 2:1:5 pattern and was identified in the same season. These three reassortment configurations persisted throughout the 2022–23 season.
Figure 7.

Hybrid plot of four influenza seasons. Each circle represents viruses from different clades, with gene segments organized by length. The left side features three dominant clades—5a, 5a.1, and 5a.2—circulating during the 2019–20 season, while the right side illustrates the re5a.1 group with three distinct patterns.
Geographic distribution of re6B.1A.5a.1
To understand the prevalence of re5a.1 from 2019 to 2023, the complete H1N1 dataset (n = 10 055) was utilized without downsampling for further analysis. Re5a.1 (n = 770) represented 26.5% of the original 5a.1 (n = 2909). A detailed compilation (Fig. 8a) showed that re5a.1, which primarily consisted of cases from the Netherlands (n = 187; 24.2%), France (n = 63; 8.2%), Togo (n = 49; 6.4%), South Africa (n = 45; 5.8%), and Kenya (n = 45; 5.8%). Further analysis of the seasonal distribution of the six clades was conducted in these countries (Table 1). Initially, the re5a.1 clade constituted 37.9% of the total sequences in the Netherlands and was dominant in the 2021–22 season; however, it was replaced by the 5a.2a and 5a.2a.1 sequences in the subsequent season. Secondly, 20.1% of the re5a.1sequences from France matched the prevalence in the Netherlands. Third, Togo exhibited a unique clade distribution compared to the other two countries. Here, 5a.1 accounted for 55.9% of sequences and re5a.1 for 31.4%, yet it was also the dominant group in the 2020–21 season. Moreover, re5a.1 continued to circulate in the 2021–22 season, declined in the subsequent season, and three dominant clades co-circulated, including re5a.1 (48.9%), 5a.2a.1 (27.8%), and 5a.2a (10%), in the 2021–22 season in South Africa. Finally, in Kenya, 5a.2a had a higher prevalence of 20.5% than 19.3% for re5a.1 in the 2021–22 season; however, in the following season, the prevalence was 34.9% and 14.5% for re5a.1 and 5a.2a, respectively.
Figure 8.

The composition of the reassortment patten in 6B.1A.5a.1 clade. (a) A pie chart was generated using the Plotly package (v4.10.2) in R language, illustrates the composition of the re5a.1 group among the top 20 countries. Each country is labelled with its respective proportion. Countries with < 1% representation are grouped under others. The subfigures correspond to detailed seasonal patterns in the top 5 countries: (b) the Netherlands, (c) France, (d) Togo, (e) South Africa, and (f) Kenya.
Table 1.
Distribution of seasonal clades in countries circulating re5a.1 sequences. In the first column, we list the top five countries for re5a.1 sequences, while the remaining columns compile the ratios of six targeted clades across four seasons. It’s important to note that only ratios exceeding 10% are included in this table. The last column provides the total sequence count for each country in our complete dataset
| Country | 2019–20 | 2020–21 | 2021–22 | 2022–23 | Total count |
|---|---|---|---|---|---|
| Netherlands | NA | NA | re5a.1 (37.9%) | 5a.2a (45.1%), 5a.2a.1 (15.6%) | 486 |
| France | 5a.1 (15.2%) | <10% | re5a.1 (20.1%) | 5a.2a (42.6%), 5a.2a.1 (11.9%) | 303 |
| Togo | <10% | 5a.1 (55.9%), re5a.1 (31.4%) | re5a.1 (10.2%) | NA | 118 |
| South Africa | <10% | NA | re5a.1 (48.9%), 5a.2a.1 (27.8%), 5a.2a (10%) | <10% | 90 |
| Kenya | 5a (10.8%) | NA | 5a.2a (20.5%), re5a.1 (19.3%) | re5a.1 (34.9%), 5a.2a (14.5%) | 83 |
Notably, the 1:1:6 re5a.1 reassortment (n = 562) predominantly comprised sequences from the Netherlands (n = 170), Togo (n = 49), South Africa (n = 45), and Kenya (n = 45). The 2:1:5 re5a.1 (n = 179) primarily consisted of samples collected from France (n = 40), the Netherlands (n = 17), and Spain (n = 15). The 2:2:4 re5a.1 (n = 29) primarily comprised sequences from Zambia (n = 16), Mozambique (n = 12), and South Africa (n = 1). Regarding seasonality, 166 re5a.1 strains isolated from the Netherlands exhibited a 1:1:6 pattern in the 2021–22 season, whereas four sequences in the 2022–23 season and a 2:1:5 pattern (n = 17) in the 2021–22 season (Fig. 8b). Similarly, re5a.1 strains isolated from France displayed a 1:1:6 pattern (n = 23) from 2021 to 2022 and a 2:1:5 pattern (n = 40) from 2021 to 2022 (Fig. 8c). In Togo, re5a.1 strains followed a 1:1:6 pattern, with 37 strains in the 2020–21 season and 12 in the 2021–22 season (Fig. 8d). In South Africa, 44 re5a.1 strains isolated in the 2021–22 season demonstrated a 1:1:6 pattern, and one sequence followed a 2:2:4 pattern in the 2022–23 season (Fig. 8e). In Kenya, re5a.1 strains exhibited a 1:1:6 pattern, with 16 strains in the 2021–22 season and 29 in the 2022–23 season (Fig. 8f).
Discussion
Our integrated use of VIDA and CatTrees enabled the detection of a distinct reassortment group, re5a.1, within the 6B.1A.5a.1 clade from the 2019–23 H1N1 dataset. Although re5a.1 did not exhibit any amino acid (or clade-defining) mutations in HA, it demonstrated several amino acid variations in other segments. Although re5a.1 did not exhibit any amino acid (or clade-defining) mutations in HA, it demonstrated several amino acid variations in other segments. Notably, the mutations included T16A in NA, I129M and K256Q in the PA segment, and D154N and K739D in PB1. These mutations in PA and PB1 revealed two reassortment patterns: 1:1:6 (HA:NP:others) and 2:1:5 (HA,PB1:NP:others). As is widely recognized, reassortment phenomena have shown a significant association with outbreaks. Avian influenza H5Nx viruses were responsible for outbreaks in the Netherlands during the 2020–21 season (Engelsma et al. 2022). Another cross-species example leading to severe disease is the combination of H3N8 with avian HA and NA segments originating from the Eurasian lineage H9N2 viruses (Bao et al. 2022). Since the 2021–22 season, H5N1 has emerged via reassortment among wild birds in Europe, spread globally, and has subsequently undergone further reassortment with low-pathogenic avian influenza in both wild and domestic birds (Xie et al. 2023). This suggests that the novel genomic features of 6B.1A.5a.1 in this study raise concerns about its potential threat to public health.
Two dominant clades, 5a.2a and 5a.2a.1, were prevalent during the 2022–23 season; however, re5a.1 continued to circulate in specific countries, including Kenya. Our dataset revealed that all 135 sequences of 5a.1 from the 2022–23 season were replaced by re5a.1. Re5a.1 demonstrated three reassortment patterns (Fig. 7). Among the 770 re5a.1 sequences, the 1:1:6 pattern (n = 562), accounting for 72.7%, predominantly comprised sequences from the Netherlands (n = 170), Togo (n = 49), and Kenya (n = 45). The 2:1:5 pattern, encompassing 179 sequences (23.2%), primarily included sequences from France (n = 40), the Netherlands (n = 17), and Spain (n = 15). The 2:2:4 pattern involved 29 sequences (3%) and was confined to Zambia (n = 16), Mozambique (n = 12), and South Africa (n = 1). Re5a.1, first identified during the 2020–21 season, supplanted the original 5a.1. The prominence of re5a.1 culminated during the 2021–22 season. According to the ECDC Influenza Virus Characterization Reports (European Centre for Disease Prevention and Control 2022), the 2021–22 season saw fewer H1N1pdm cases amid the ongoing COVID-19 pandemic. Therefore, studying the development of re5a.1 is crucial for understanding influenza activity during pandemics. However, limited research on re5a.1 complicates efforts to conclusively associate it with clinical outcomes. Previous studies explored the relationship between gene reassortment and clinical outcomes (Liu et al. 2021, Fall et al. 2023, Liu et al. 2024). This suggests that further studying re5a.1 in relation to clinical signs is essential.
Despite the prevalent challenges in reassortment detection, such as its time-consuming issue, analysing large datasets adds further complexities. The sheer volume of data exacerbates computational demands, prolongs the process of identifying reassortment events, and provides a comprehensive understanding of their implications. Additionally, the capacity of reassortment detection tools, such as GiRaF, used in this study is limited. Although GiRaF successfully identified reassortment strains within our small dataset during the 2020–22 season, it encountered difficulties in processing our larger dataset owing to memory constraints. CatTrees offers a promising solution by enhancing the efficiency of reassortment pattern interpretation. This preserved the reassortment patterns of re5a.1 in the downsampled dataset, which is consistent with the GiRaF results of our smaller dataset. CatTrees enables the visualization of complex phylogenetic relationships, allowing the display of multiple trees. Its effectiveness on influenza datasets was demonstrated in this study, providing valuable insights into outbreaks and pandemic situations.
The applicability of CatTrees extends beyond influenza, offering a webpage for studying reassortment and recombination across various viruses. Using the VIDA toolkit, which streamlines essential preprocessing steps such as sequence filtering and segment separation, we identified a reassortment group within the 6B.1A.5a.1 clade (termed re5a.1) from the 2019–23 H1N1 dataset. By equipping researchers with both analytical and visualization tools, this pipeline enables rapid detection of genomic reassortment events that may indicate changes in evolutionary and epidemiological dynamics.
Supplementary Material
Acknowledgements
We gratefully acknowledge the authors, originating and submitting laboratories of the sequences from GISAID’s EpiFlu™ Database on which this research is based.
Contributor Information
Tai-Jung Li, International Master Degree Program for Molecular Medicine in Emerging Viral Infections, College of Medicine, Chang Gung University, No. 259, Wenhua 1st Rd., Guishan Dist., Taoyuan City 33302, Taiwan.
Kuan-Fu Chen, Research Center for Emerging Viral Infections, College of Medicine, Chang Gung University, No. 259, Wenhua 1st Rd., Guishan Dist., Taoyuan City 33302, Taiwan; College of Intelligent Computing, Chang Gung University, No. 259, Wenhua 1st Rd., Guishan Dist., Taoyuan City 33302, Taiwan; Department of Emergency Medicine, Keelung Chang Gung Memorial Hospital, No. 222, Maijin Rd., Anle Dist., Keelung City 20401, Taiwan.
Andrew Pekosz, W. Harry Feinstone Department of Molecular Microbiology and Immunology, Johns Hopkins Bloomberg School of Public Health, 615 N. Wolfe Street, Baltimore, MD 21205, United States.
Yu-Nong Gong, International Master Degree Program for Molecular Medicine in Emerging Viral Infections, College of Medicine, Chang Gung University, No. 259, Wenhua 1st Rd., Guishan Dist., Taoyuan City 33302, Taiwan; Research Center for Emerging Viral Infections, College of Medicine, Chang Gung University, No. 259, Wenhua 1st Rd., Guishan Dist., Taoyuan City 33302, Taiwan; Department of Emergency Medicine, Keelung Chang Gung Memorial Hospital, No. 222, Maijin Rd., Anle Dist., Keelung City 20401, Taiwan; Department of Laboratory Medicine, Linkou Chang Gung Memorial Hospital, No.5, Fuxing St., Guishan Dist., Taoyuan City 33305, Taiwan.
Conflict of interest: None declared.
Funding
This work was financially supported by NIAID-supported Center of Excellence for Influenza Research and Response 75N93021C00045 in the USA, the Research Center for Emerging Viral Infections from The Featured Areas Research Center Program within the framework of the Higher Education Sprout Project by the Ministry of Education (MOE), and National Science and Technology Council (NSTC, 111-2221-E-182-053-MY3 and 114-2221-E-182-009-MY3) in Taiwan.
Data availability
All of sequence data utilized in generating the figures can be accessed at GISAID, with specific sample accession numbers and metadata detailed in Supplementary Table S1.
Code availability
The analysis pipeline with a Virus Data Analysis toolkit (VIDA) used in this study is available at https://github.com/yngong/vida. This repository provides scripts for sequence preprocessing and automates the execution of tools for multiple sequence alignment, phylogenetic tree analysis, and clade assignment, ensuring full reproducibility of the workflow. The source code for Crossing lines Annotating with Tanglegrams on Trees (CatTrees) is available at https://github.com/deb03090215/CatTrees, and the web-based version is freely accessible at https://yngong.shinyapps.io/CatTrees/.
References
- Aksamentov I, Roemer C, Hodcroft E et al. Nextclade: clade assignment, mutation calling and quality control for viral genomes. J Open Source Softw 2021;6:3773. 10.21105/joss.03773 [DOI] [Google Scholar]
- Bao P, Liu Y, Zhang X et al. Human infection with a reassortment avian influenza A H3N8 virus: an epidemiological investigation study. Nat Commun 2022;13:6817. 10.1038/s41467-022-34601-1 [DOI] [PMC free article] [PubMed] [Google Scholar]
- Barrat-Charlaix P, Vaughan TG, Neher RA. TreeKnit: inferring ancestral reassortment graphs of influenza viruses. PLoS Comput Biol 2022;18:e1010394. 10.1371/journal.pcbi.1010394 [DOI] [PMC free article] [PubMed] [Google Scholar]
- Borges WC, Cheng J, Allaire JJ et al. Shiny: web application framework for R. 2024. https://shiny.posit.co/
- Engelsma M, Heutink R, Harders F et al. Multiple introductions of reassorted highly pathogenic avian influenza H5Nx viruses clade 2.3.4.4b causing outbreaks in wild birds and poultry in the Netherlands, 2020-2021. Microbiol Spectr 2022;10:e0249921. 10.1128/spectrum.02499-21 [DOI] [PMC free article] [PubMed] [Google Scholar]
- European Centre for Disease Prevention and Control (ECDC) . Influenza virus characterization—summary Europe, October 2022. 2022. https://www.ecdc.europa.eu/en/publications-data/influenza-virus-characterization-summary-europe-october-2022
- Fall A, Han L, Yunker M et al. Evolution of influenza A(H3N2) viruses in 2 consecutive seasons of genomic surveillance, 2021-2023. Open Forum Infect Dis 2023;10:ofad577. 10.1093/ofid/ofad577 [DOI] [PMC free article] [PubMed] [Google Scholar]
- Galili T. dendextend: an R package for visualizing, adjusting and comparing trees of hierarchical clustering. Bioinformatics 2015;31:3718–20. 10.1093/bioinformatics/btv428 [DOI] [PMC free article] [PubMed] [Google Scholar]
- Gong X, Hu M, Wang B et al. A non-phylogeny-dependent reassortment detection method for influenza A viruses. Front Virol 2021;1:751196. 10.3389/fviro.2021.751196 [DOI] [Google Scholar]
- Harrington WN, Kackos CM, Webby RJ. The evolution and future of influenza pandemic preparedness. Exp Mol Med 2021;53:737–49. 10.1038/s12276-021-00603-0 [DOI] [PMC free article] [PubMed] [Google Scholar]
- Hassan KE, Saad N, Abozeid HH et al. Genotyping and reassortment analysis of highly pathogenic avian influenza viruses H5N8 and H5N2 from Egypt reveals successive annual replacement of genotypes. Infect Genet Evol 2020;84:104375. 10.1016/j.meegid.2020.104375 [DOI] [PubMed] [Google Scholar]
- He D, Wang X, Wu H et al. Genome-wide reassortment analysis of influenza A H7N9 viruses circulating in China during 2013-2019. Viruses 2022;14:1256. 10.3390/v14061256 [DOI] [PMC free article] [PubMed] [Google Scholar]
- Katoh K, Standley DM. MAFFT multiple sequence alignment software version 7: improvements in performance and usability. Mol Biol Evol 2013;30:772–80. 10.1093/molbev/mst010 [DOI] [PMC free article] [PubMed] [Google Scholar]
- Liu H, Gong YN, Shaw-Saliba K et al. Differential disease severity and whole-genome sequence analysis for human influenza A/H1N1pdm virus in 2015-2016 influenza season. Virus Evol 2021;7:veab044. 10.1093/ve/veab044 [DOI] [PMC free article] [PubMed] [Google Scholar]
- Liu H, Shaw-Saliba K, Westerbeck J et al. Effect of human H3N2 influenza virus reassortment on influenza incidence and severity during the 2017-18 influenza season in the USA: a retrospective observational genomic analysis. Lancet Microbe 2024;5:100852. 10.1016/S2666-5247(24)00067-3 [DOI] [PMC free article] [PubMed] [Google Scholar]
- Martin DP, Varsani A, Roumagnac P et al. RDP5: a computer program for analyzing recombination in, and removing signals of recombination from, nucleotide sequence datasets. Virus Evol 2021;7:veaa087. 10.1093/ve/veaa087 [DOI] [PMC free article] [PubMed] [Google Scholar]
- McDonald SM, Nelson MI, Turner PE et al. Reassortment in segmented RNA viruses: mechanisms and outcomes. Nat Rev Microbiol 2016;14:448–60. 10.1038/nrmicro.2016.46 [DOI] [PMC free article] [PubMed] [Google Scholar]
- Nagarajan N, Kingsford C. GiRaF: robust, computational identification of influenza reassortments via graph mining. Nucleic Acids Res 2010;39:e34–4. 10.1093/nar/gkq1232 [DOI] [PMC free article] [PubMed] [Google Scholar]
- Price MN, Dehal PS, Arkin AP. FastTree 2—approximately maximum-likelihood trees for large alignments. PLoS One 2010;5:e9490. 10.1371/journal.pone.0009490 [DOI] [PMC free article] [PubMed] [Google Scholar]
- Samson S, Lord E, Makarenkov V. SimPlot++: a Python application for representing sequence similarity and detecting recombination. Bioinformatics 2022;38:3118–20. 10.1093/bioinformatics/btac287 [DOI] [PubMed] [Google Scholar]
- Shu Y, McCauley J. GISAID: global initiative on sharing all influenza data—from vision to reality. Euro Surveill 2017;22:30494. 10.2807/1560-7917.ES.2017.22.13.30494 [DOI] [PMC free article] [PubMed] [Google Scholar]
- Steel J, Lowen AC. Influenza A virus reassortment. Curr Top Microbiol Immunol 2014;385:377–401. 10.1007/82_2014_395 [DOI] [PubMed] [Google Scholar]
- Venkatesh D, Brouwer A, Goujgoulova G et al. Regional transmission and reassortment of 2.3.4.4b highly pathogenic avian influenza (HPAI) viruses in Bulgarian poultry 2017/18. Viruses 2020;12:605. 10.3390/v12060605 [DOI] [PMC free article] [PubMed] [Google Scholar]
- Xie R, Edwards KM, Wille M et al. The episodic resurgence of highly pathogenic avian influenza H5 virus. Nature 2023;622:810–7. 10.1038/s41586-023-06631-2 [DOI] [PubMed] [Google Scholar]
- Yin R, Zhou X, Rashid S et al. HopPER: an adaptive model for probability estimation of influenza reassortment through host prediction. BMC Med Genet 2020;13:9. 10.1186/s12920-019-0656-7 [DOI] [PMC free article] [PubMed] [Google Scholar]
- Yu G. Using ggtree to visualize data on tree-like structures. Curr Protoc Bioinformatics 2020;69:e96. 10.1002/cpbi.96 [DOI] [PubMed] [Google Scholar]
Associated Data
This section collects any data citations, data availability statements, or supplementary materials included in this article.
Supplementary Materials
Data Availability Statement
All of sequence data utilized in generating the figures can be accessed at GISAID, with specific sample accession numbers and metadata detailed in Supplementary Table S1.