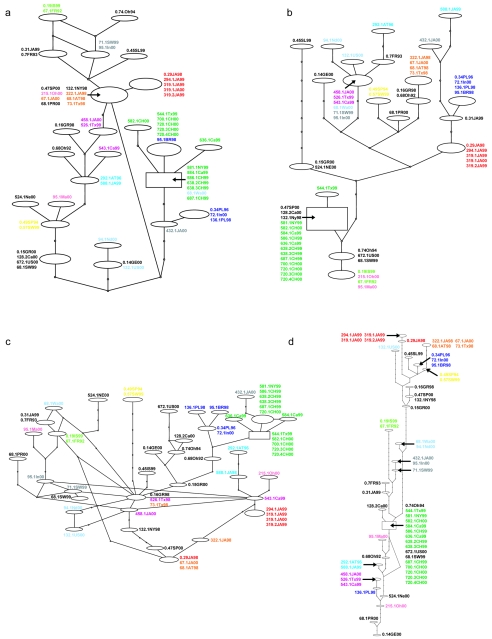
FIG. 3.
Statistical parsimony network (TCS) for each of the respective fluoroquinolone target loci; (a) parE; (b) gyrA (c) parC; (d) gyrB. Ovals represent different haplotypes, with the laboratory identifications for the isolates comprising that haplotype indicated adjacently. The number of steps (intermediate or unsampled haplotypes) separating different haplotypes are represented by the nodes appearing on the branches. The rectangle represents the TCS determination of the haplotype most likely to be ancestral for this set of sequences. The color scheme is identical to that in Fig. 1.

