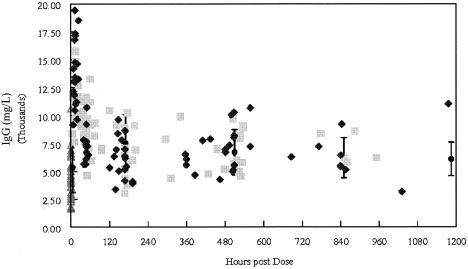
FIG. 5.
IgG concentrations from infants in the present study (gray squares, 500-mg/kg group; black diamonds, 750-mg/kg group) compared to the mean ± standard deviation reported by Baker et al. (2) (solid circles), adjusted for dose (to 750 mg/kg). Open triangles, predose concentrations.

