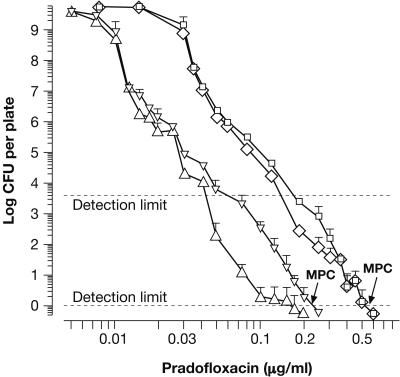
FIG. 2.
Phenotypic heterogeneity in large populations of E. coli ATCC 8739 and S. aureus ATCC 6538 as revealed upon successive inhibition of colony formation by increasing concentrations of PRA. Graphs representing residual CFU of E. coli after 5 days (▵, regular colony morphology; ▿, total CFU including SCVs) and of S. aureus after 7 days of incubation (⋄, regular morphology; □, total CFU including SCVs) were compiled from 7 and 11 experiments, respectively. At the MPC, no visible growth was detectable. Subsequent increases in CFU, observed until day 14, did not affect the MPCs. Susceptibility of individual clones varied between 1 and 10 times the MIC (see Table 1). The upper detection limit indicates the maximum number of CFU resolved on one agar plate.

