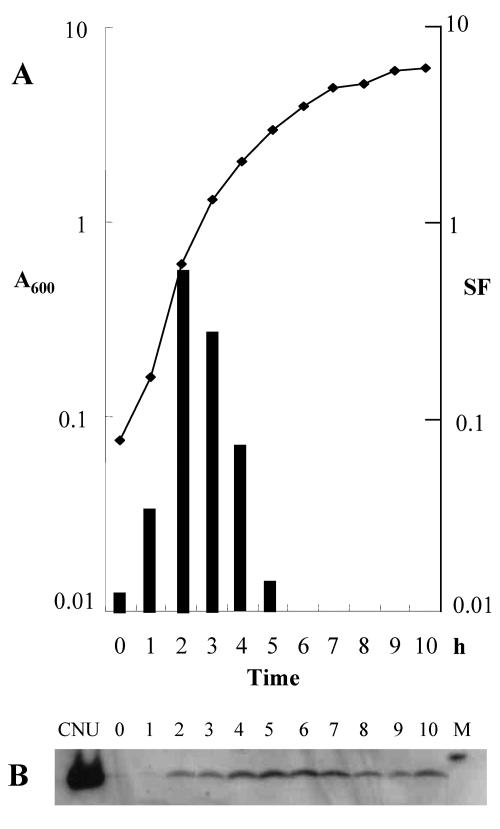
FIG. 2.
(A) SF measurements at various times during growth of HB101/pOri-3. The line graph (growth curve) shows A600 values at different time points. The bars represent SF values at the corresponding time points. (B) Western blots of Cnu at various times during growth of HB101. The first lane (Cnu) is the purified Cnu protein (1 μg). The numbers indicate the time points in panel A. Crude extracts (20 μg of protein) from the culture at each time point were loaded. Lane M is the 10-kDa Western size marker (ELPis-Biotech, Taejean, Korea).

