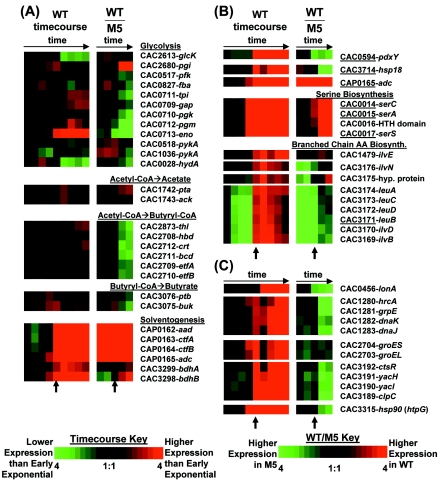
FIG. 2.
Colorimetric expression profiles, or Eisen plots (20), of genes related to primary metabolism (A), genes whose protein products were previously identified as being differentially expressed during solventogenesis by Schaffer et al. (69) (B), and heat shock proteins (C) during the WT time course and WT-M5 comparison. Genes specifically identified by Schaffer and colleagues are underlined; other related genes, such as within a putative operon or functional group, have also been included. In panel A, genes are listed in the order of the reaction pathway. In panels B and C, putative operons are listed in the order of transcription. Short arrows beneath the Eisen plots denote the onset of stationary-phase gene expression (spo0A and aad-ctfA-ctfB expression).

