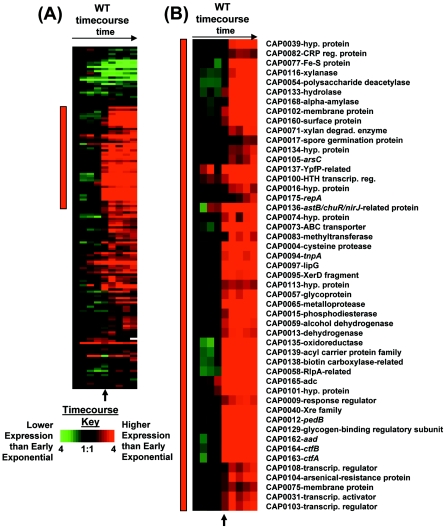
FIG. 4.
Expression profiles of 160 pSOL1 genes (A) and a selected cluster of upregulated genes (B). The red bar in panel A indicates the location of the selected genes in panel B. The arrow indicates the onset of solventogenesis and sporulation. The colorimetric scale is the same as in Fig. 2. White squares indicate that microarray signals were too close to the background to calculate a ratio. hyp., hypothetical; reg., regulatory; degrad., degrading; transcrip. reg., transcription regulator.

