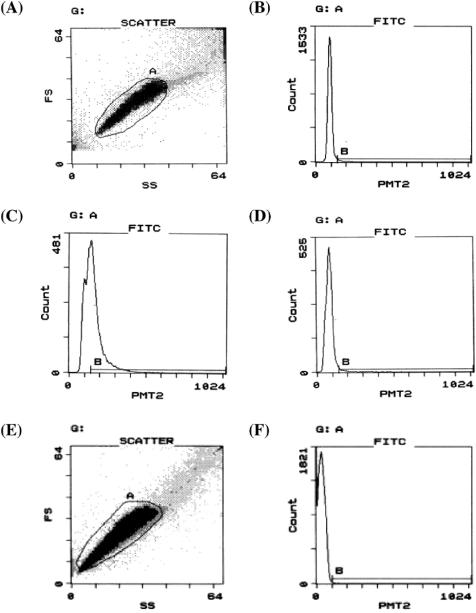
Figure 3.
Flow cytometry of bead–DNA–PhaR–antibody complexes. (A) Typical dot-plot for beads containing Pp and negative-control fragments in FS (forward scatter) and SS (side scatter). Events gated in A (∼80% of total events) were subjected to the following analysis. (B) Histogram for ‘negative-control’ beads in FITC fluorescence intensity (for A-gated events). Events in region B were 1.6% of A-gated events. (C) Histogram for ‘positive-control’ beads in FITC fluorescence intensity (for A-gated events). Events in region B were 51.5% of A-gated events. (D) Typical histogram for beads containing Pp and negative-control fragments in FITC fluorescence intensity (for A-gated events). Events in region B were sorted. (E) Typical dot-plot of beads containing P.denitrificans genomic library in FS and SS. Events gated in A (∼97% of total events) were subjected to the following analysis. (F) Typical histogram for beads containing P.denitrificans genomic library in FITC fluorescence intensity (for A-gated events). Events in region B were sorted. PMT2, fluorescence channel 2 (FITC) signal intensity.

